GeoIntelligence Use Cases for Insurance

Looking to leverage spatial and hazard data, but unsure how it fits your insurance operations? Explore key insurance use cases powered by Quarticle’s GeoIntelligence platform.

1. Integrated Natural Hazard Risk Analytics

Gain a unified view of multiple natural hazards combined with your portfolio data for comprehensive risk understanding. This integration helps identify coverage gaps, ensures resilience, and supports climate adaptation strategies.
Map visualization in Graph by Quarticle showing multiple hazard layers overlaid with portfolio locations. The interface displays hazard intensity zones and an analytics panel summarizing exposure values for different natural hazards.

2. Flood Risk Management & Pricing

Leverage high-resolution, multi-source flood hazard data and property-level insights to underwrite and price more precisely. Dynamic flood risk profiles reduce unexpected losses, enable new products in underserved markets, and support rigorous regulatory stress tests.
Discover how Quarticle performed flood data management for a Switzerland-based global reinsurance leader
Flood exposure map in Graph by Quarticle showing high-risk flood zones over a river basin. Blue-shaded areas indicate varying flood depths and risk levels, while a property-level data table lists exposed assets below.

3. Wildfire Risk Assessment & Modeling

Harness predicted fire probabilities with near-real-time satellite monitoring to manage wildfire exposure dynamically. Enable agile underwriting rules, rapid claims assessment, and active portfolio risk mitigation in fire-prone areas.
Geographical layer in Graph by Quarticle displaying global fire hazard across a region. Darker orange and red areas highlight higher fire risk, while lighter shades show less exposed areas.

4. Earthquake Risk Modeling & Preparedness

Integrate seismic hazard maps, building vulnerability assessments, and parametric triggers to quantify earthquake exposure and facilitate rapid post-event liquidity. Support compliance with regulatory requirements and optimize reinsurance buying with advanced risk analytics.
Seismic hazard map in Graph by Quarticle illustrating earthquake exposure intensity across a region in Romania. Color gradients indicate varying seismic risk levels, with mapped portfolio points showing exposed locations.

5. Multi-Peril Integration & Climate Adaptation

Simulate complex interdependencies across floods, wildfires, hurricanes, and more using scenario testing. Adapt your portfolio and product strategy to evolving climate risks with comprehensive, multi-hazard intelligence.
Comprehensive multi-hazard map in Graph by Quarticle combining landslides and earthquake layers over a regional base map. Symbols and colored overlays depict overlapping risk zones for integrated climate adaptation analysis.

6. Rapid Damage Assessment & Claims Processing

Accelerate claims handling with near-real-time satellite and Earth observation data that detect flood depths, fire damage, and property impacts within hours of an event. Enhance fraud detection and improve customer experience through faster payouts.
Highlighted map area displaying accumulated event footprints, with visual indicators for damage extent and severity, property valuations, and calculation results that support rapid claims processing, all enabled by EventHub and shown in the Quarticle Graph interface.

7. Early Warning & Proactive Risk Management

Transform risk response with hazard forecasting and early warning systems that anticipate floods, fires, and other threats days in advance. Empower preparation and risk mitigation by issuing customer alerts and adjusting underwriting accordingly.
Talk to Our Risk Experts
An urban hazard forecast map with hazard markers indicating early warning sites across a city, visualized for proactive risk management in Graph by Quarticle.

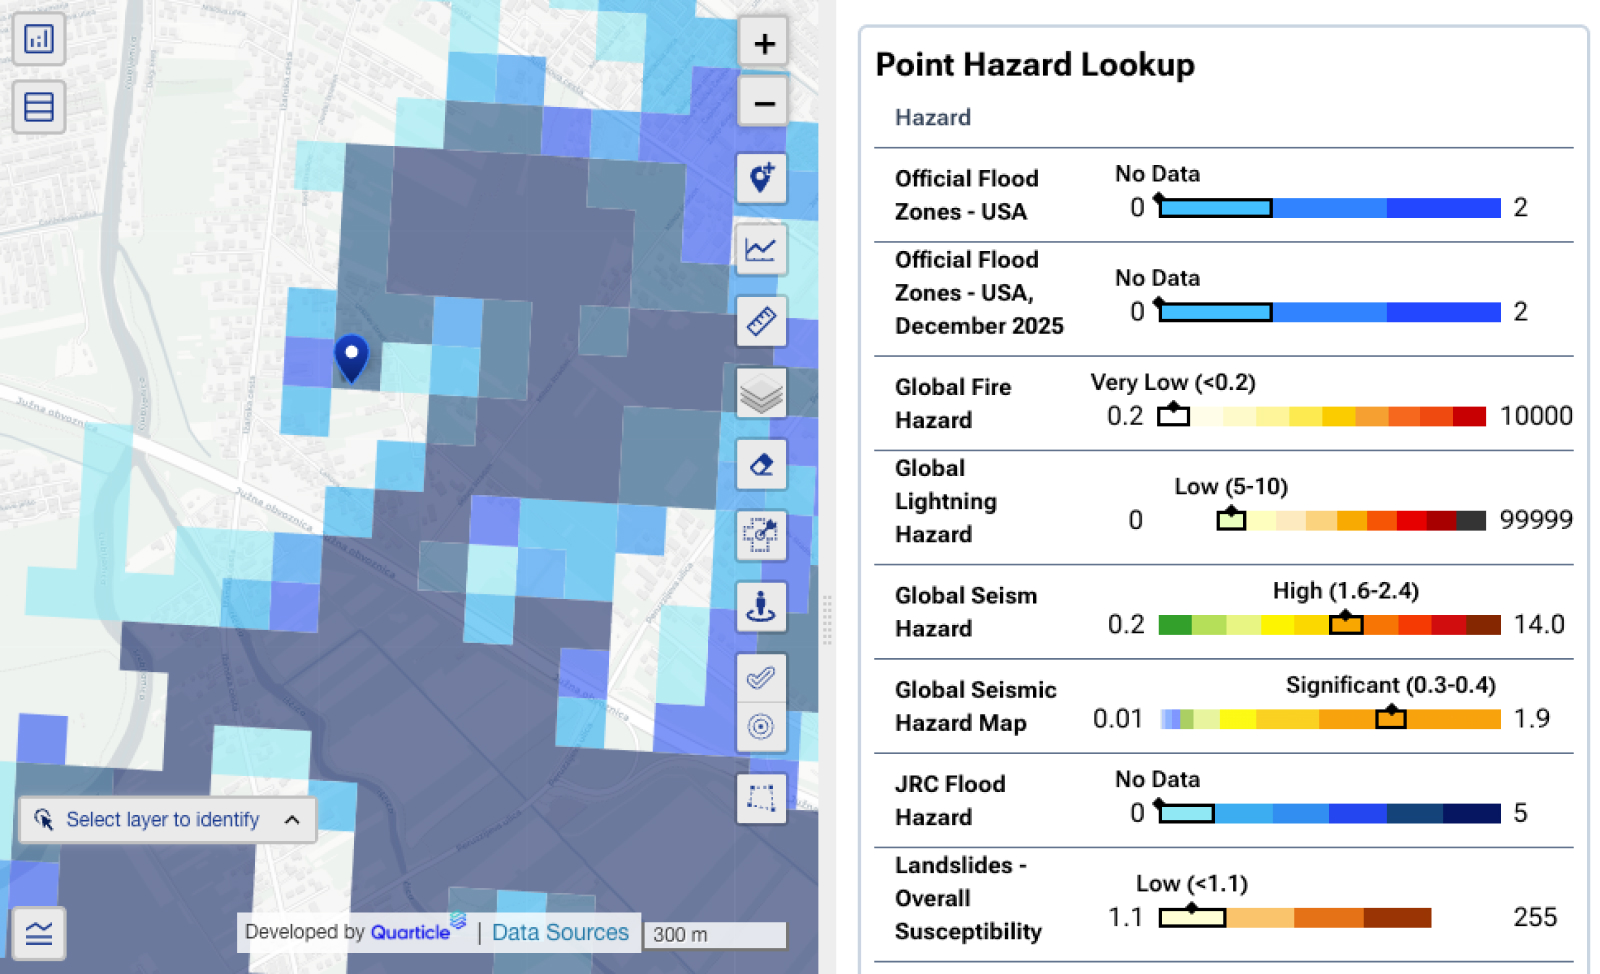
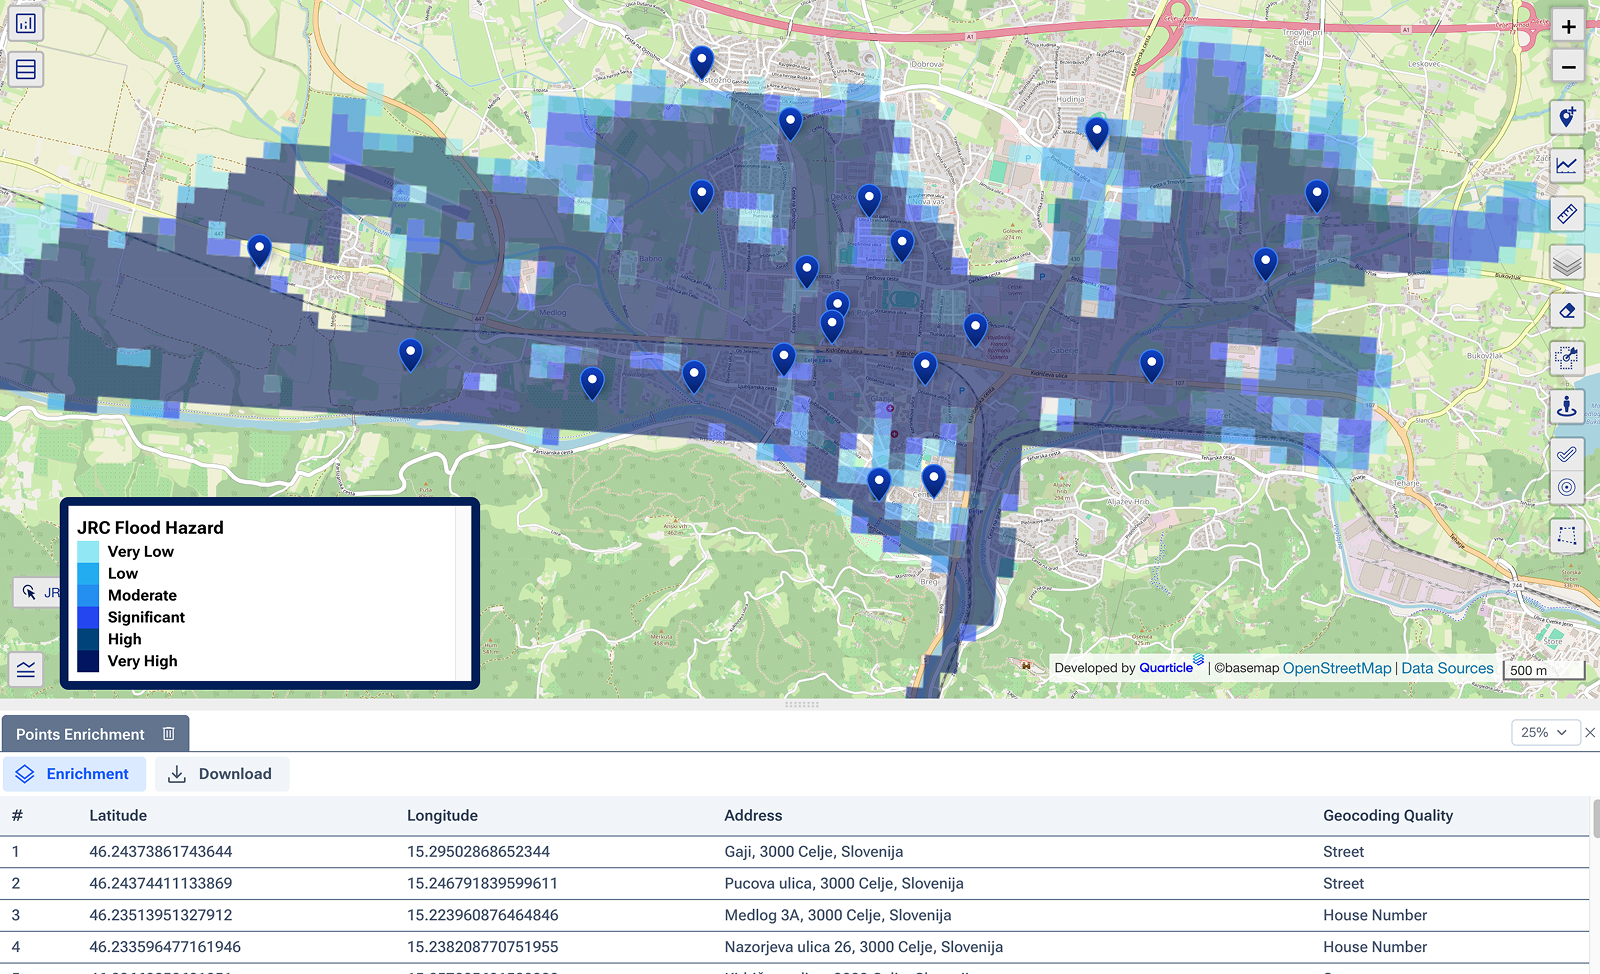
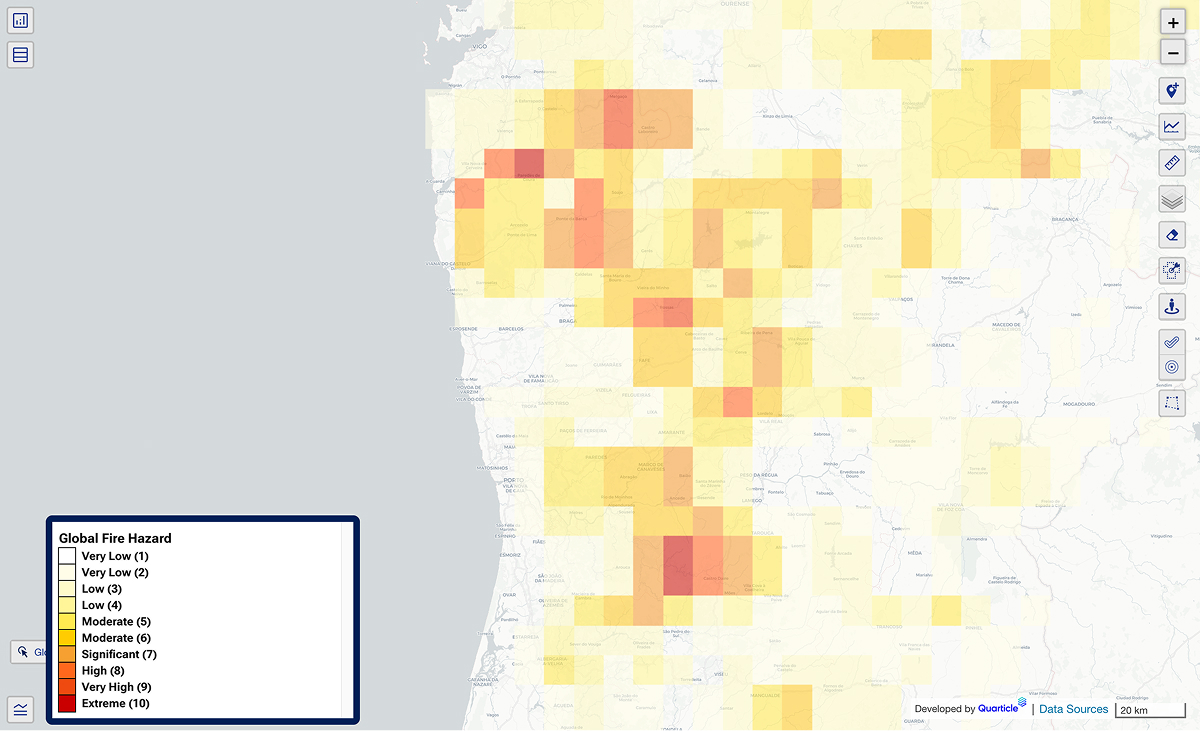
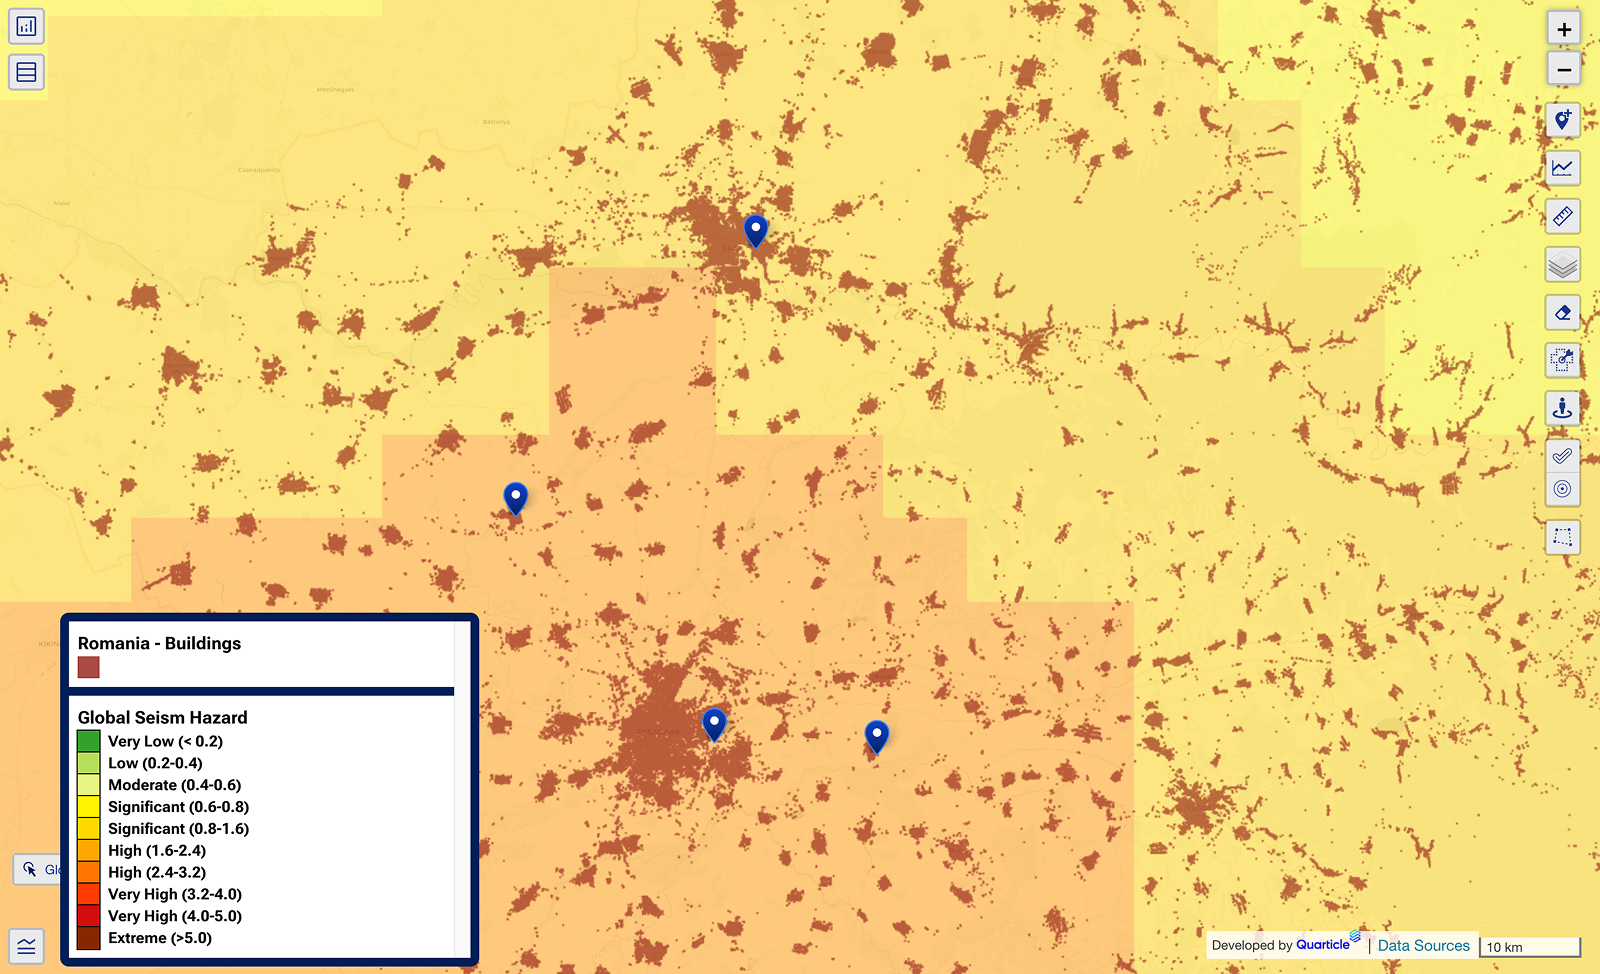
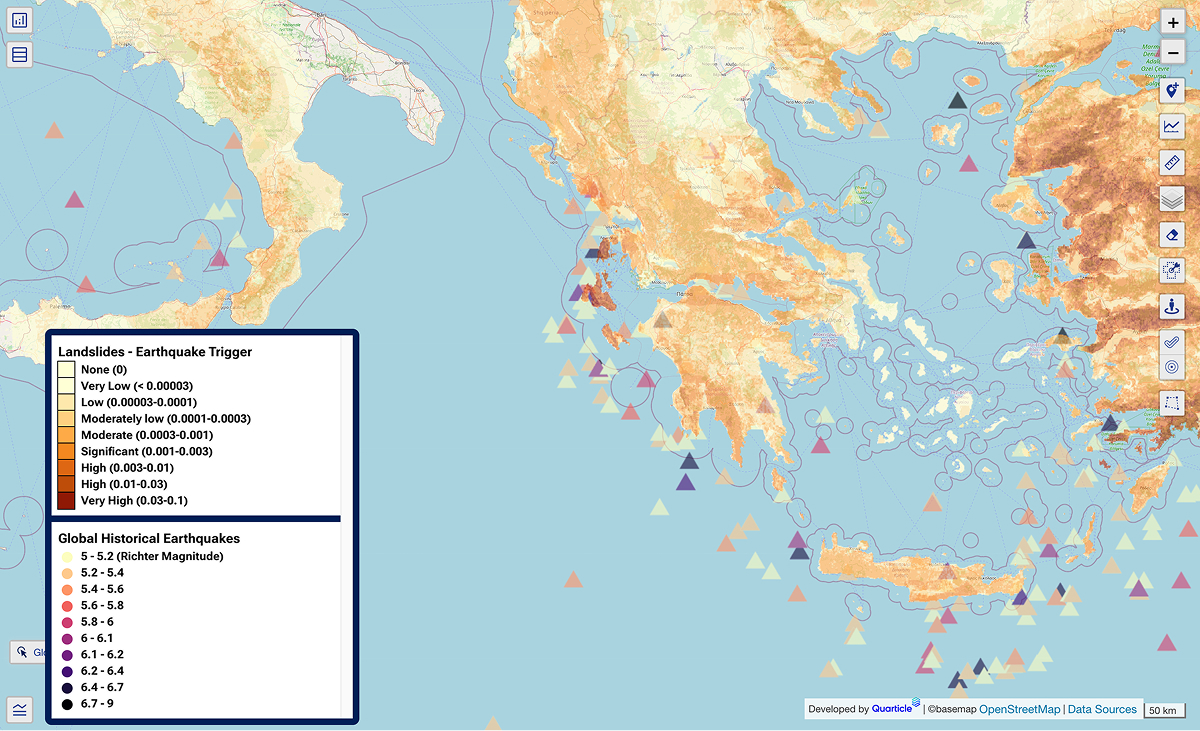
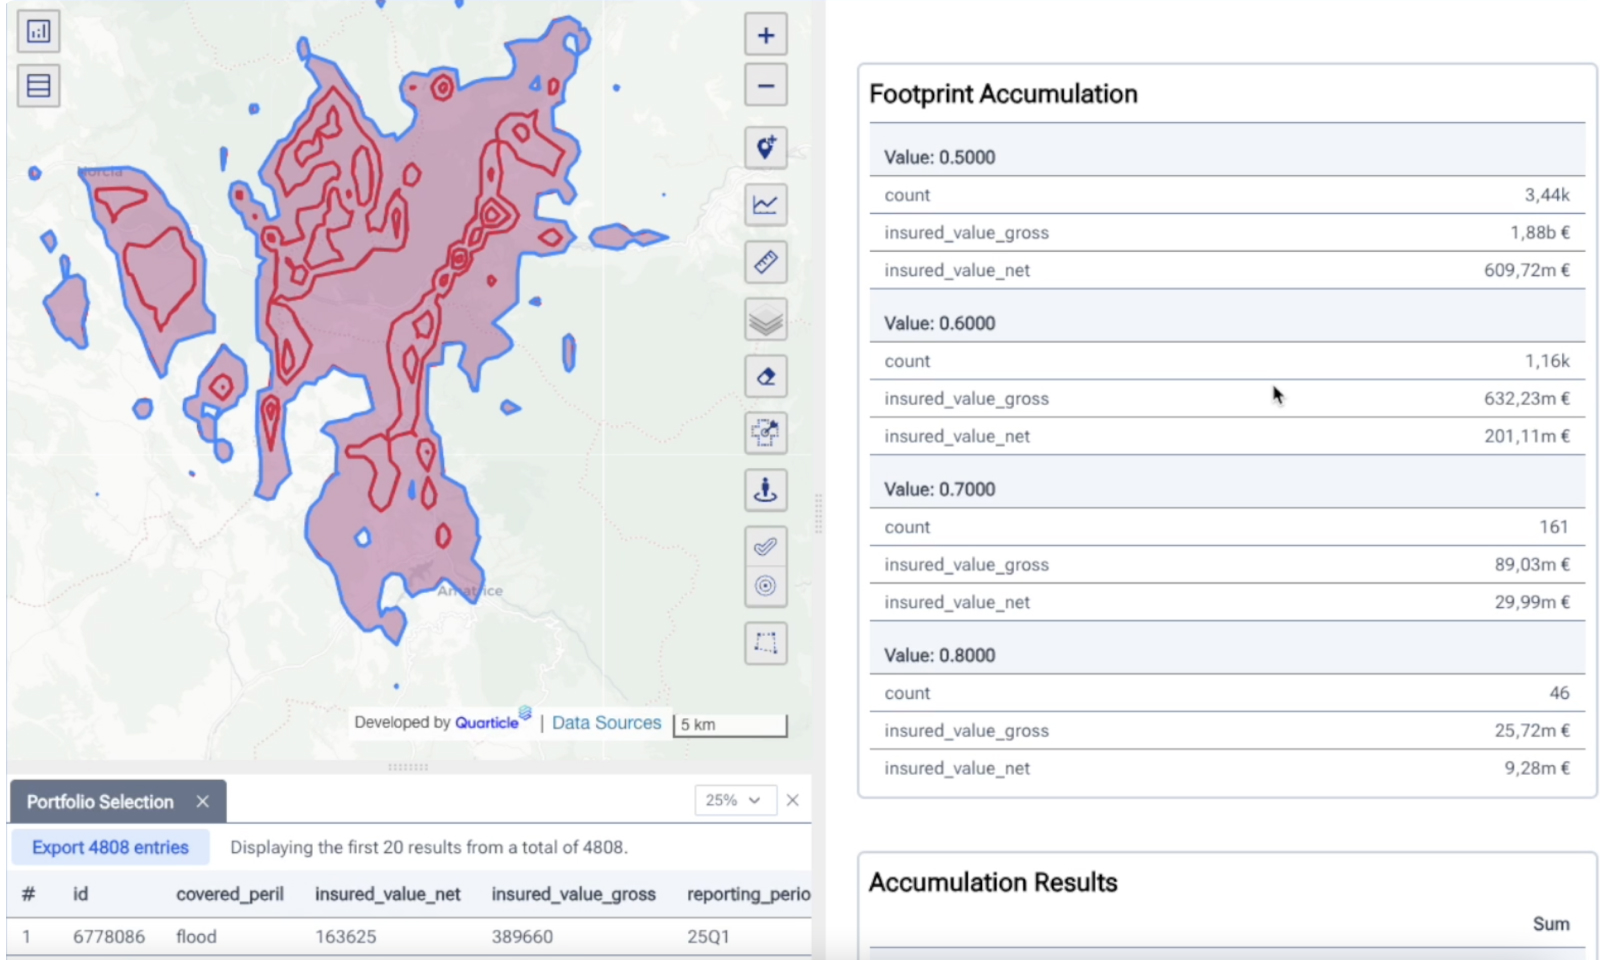
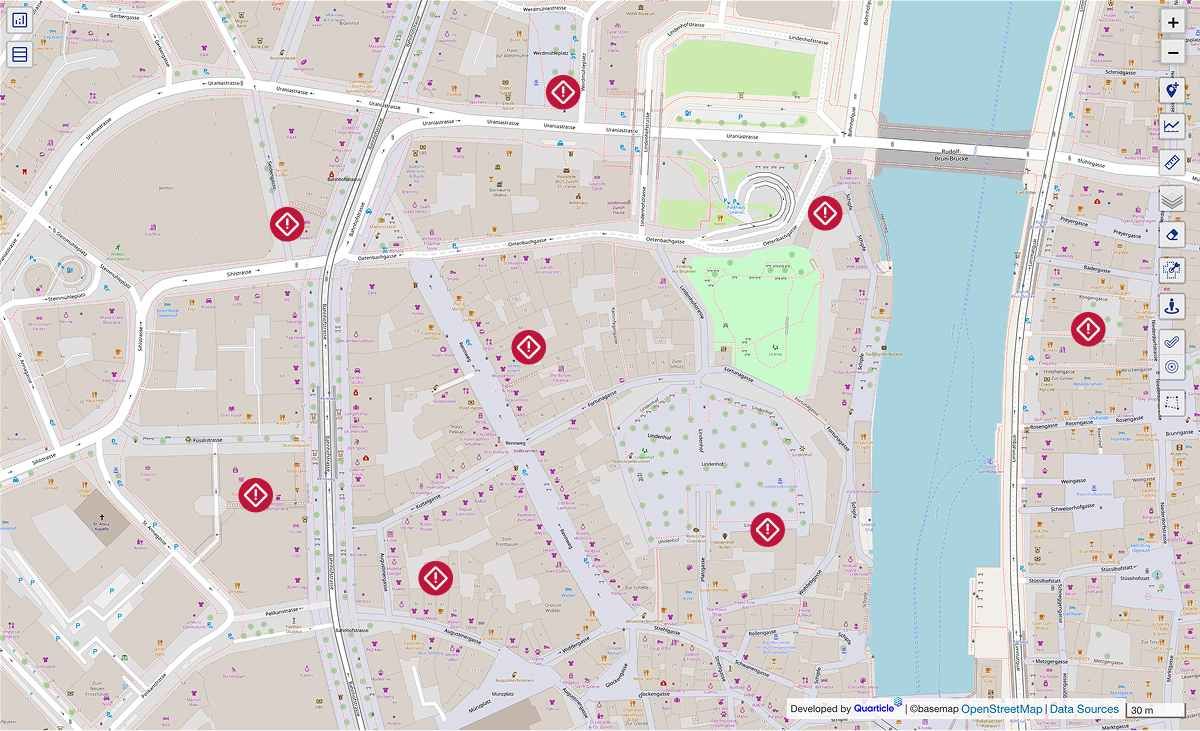
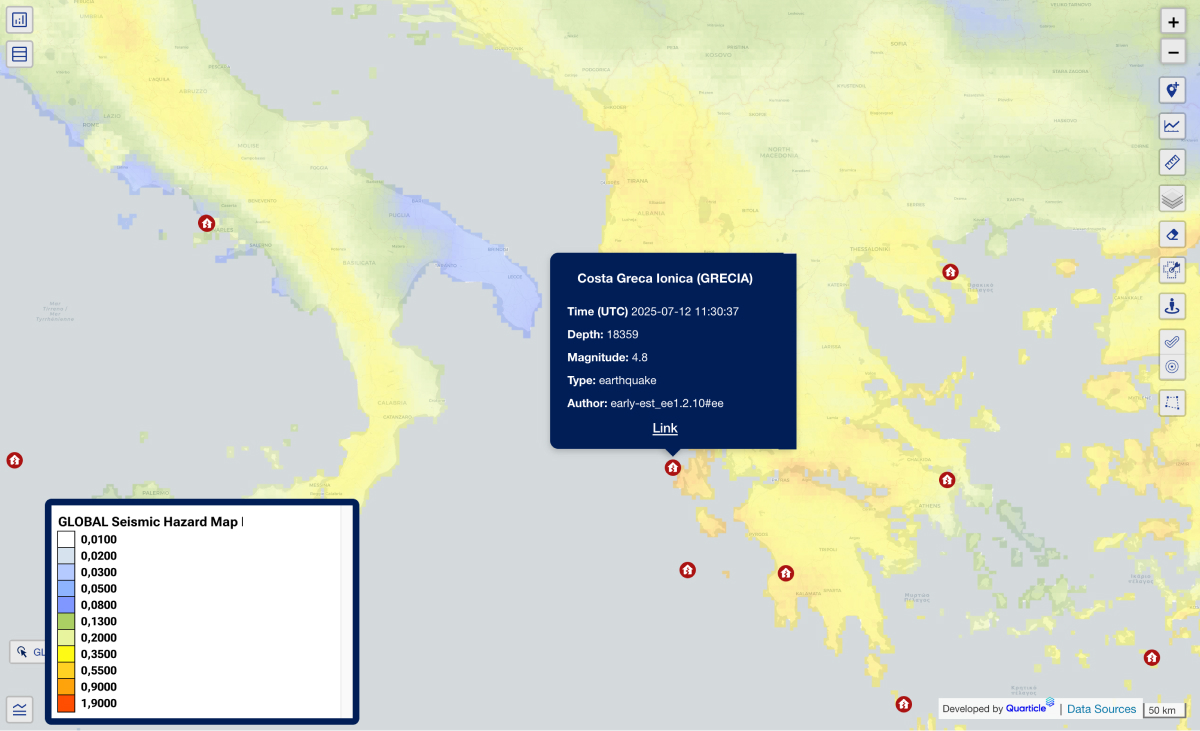
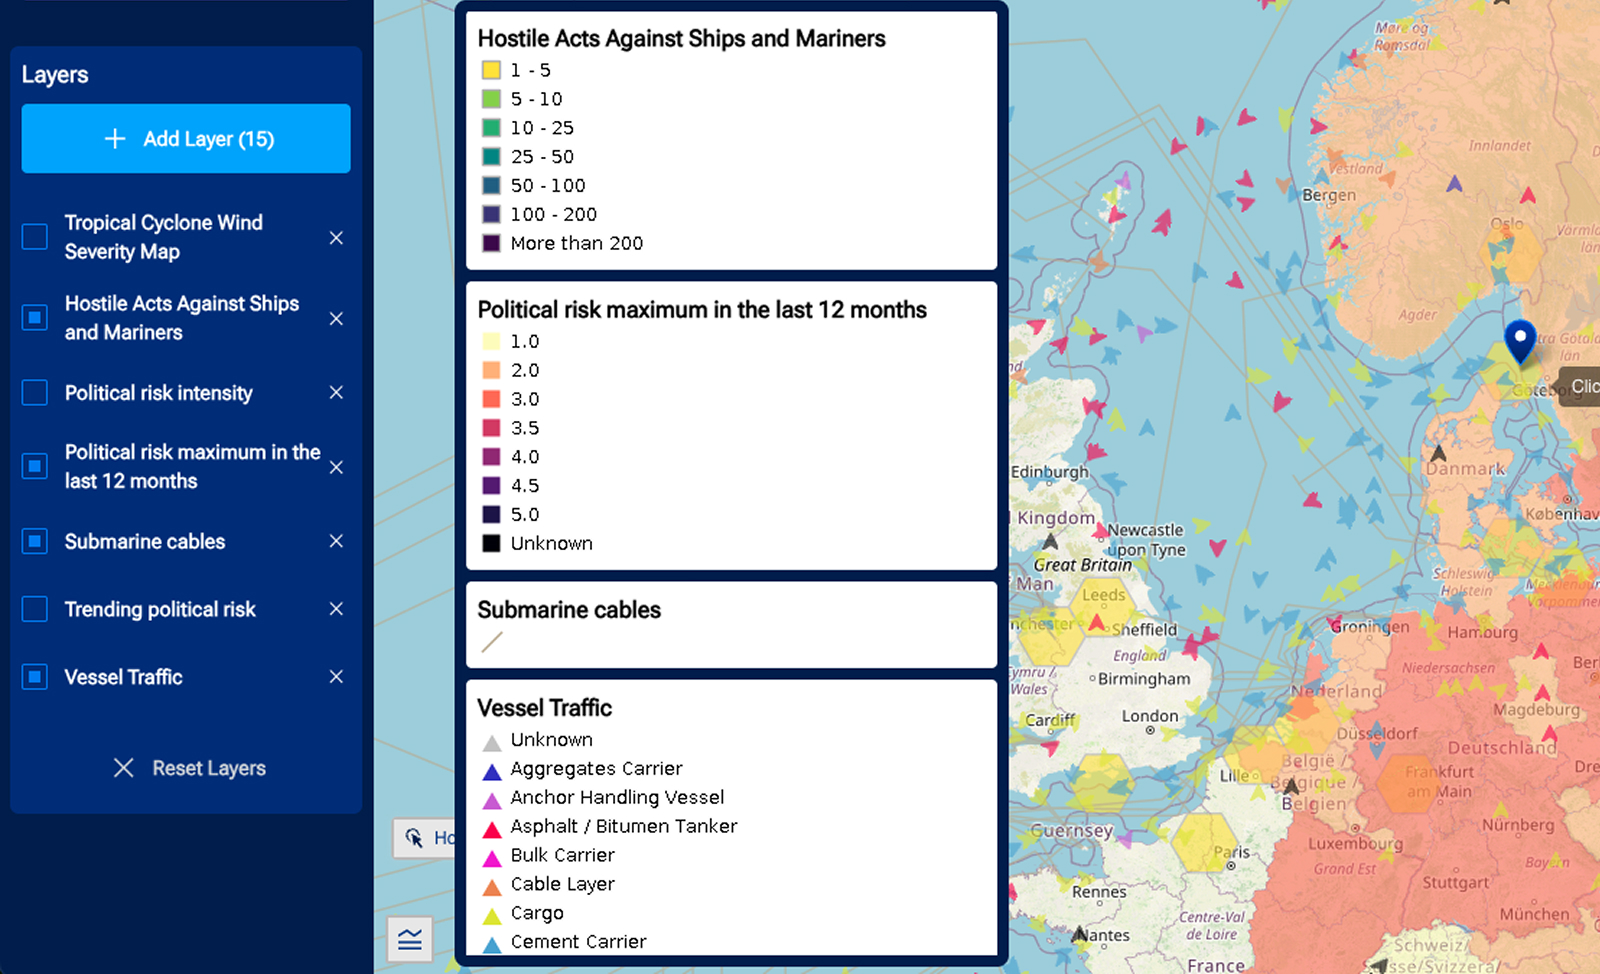
8. Continuous Monitoring & Multi-Peril Catastrophe Response

Maintain live situational awareness with frequent updates on flood progression, wildfire spread, and storm impacts. Activate parametric triggers, quantify portfolio impacts, and optimize reinsurance strategies in real time, enabling faster decisions and stronger capital management.
Map visualization in Graph by Quarticle presenting a global seismic hazard layer with risk zones depicted in color gradients; multiple live event markers highlight recent seismic activity for real-time catastrophe monitoring and multi-peril response.

9. Agricultural & Specialty Lines Support

Integrate agricultural, environmental, and infrastructure datasets into a unified view, enabling innovative solutions in agriculture and marine sectors. By combining short-term event intelligence with long-term climate monitoring, insurers can expand specialty market coverage and align strategies with global climate resilience goals.
Talk to Our Experts
Agricultural risk and land use map in Graph by Quarticle featuring diverse land classification overlays, and highlighted regions, designed for specialty lines support and climate monitoring across agricultural sectors.

10. CRESTA Zones: Standardizing Risk Geography

Employ CRESTA boundaries to standardize exposure aggregation, enhance catastrophe modeling, and meet regulatory requirements. Use CRESTA overlays to improve pricing discipline, claims prioritization, and strategic portfolio planning.
Exposure aggregation map in Graph by Quarticle showing CRESTA zones; color-coded areas clearly delineate boundaries to support standardized risk modeling and portfolio planning.

11. Geopolitical Risk Data: Navigating Instability with Intelligence

Integrate political risk datasets and conflict indicators into underwriting and real-time portfolio monitoring. Anticipate instability impacts on assets, supply chains, and personnel to reduce losses and strengthen operational resilience.
Geopolitical risk map in Graph by Quarticle presenting hostile acts against ships and mariners across a continental region, enabling insurance teams to monitor and assess political instability indicators impacting global portfolios.

12. Portfolio Data: Unlocking Intelligence from Within

Turn raw internal data into actionable insight through automated cleansing and advanced enrichment. Strengthen underwriting precision, optimize claims management, detect fraud, and predict risk trends across all lines of business.
A map interface showing diverse layers, including geopolitical risk maximums in the last 12 months, hostile acts against ships, submarine cables, and vessel traffic, illustrating portfolio data intelligence for underwriting and claims optimization in Graph by Quarticle.

13. Postal Codes

Utilize postal code boundary data to streamline territory planning, pricing, risk screening, and marketing. Combine with demographic and hazard layers to enhance portfolio management, regulatory compliance, and fraud detection.
Access high-precision postal boundaries via Quarticle Data Hub
A detailed postal code boundary map visualized in Graph by Quarticle with color-coded zones representing different postal areas in Romania, used for territory planning, and risk screening.

14. Social Demographics

Leverage granular demographic data mapped to geographic units to design targeted products, pre-screen high-risk segments, and optimize marketing strategies. Improve claims handling and fraud detection by understanding socio-economic influences on risk behavior.
A granular demographic map shown in Graph by Quarticle, displaying Europe population densities with heat mapping shown over geographic units, supporting targeted marketing and fraud detection.

15. Regulatory Reporting, Compliance & Policy Audits

Meet evolving regulatory standards and transparency requirements with built-in workflows for Solvency II, IFRS17, VAIT, and DORA. Automate audit trails, stress testing, and reporting to minimize compliance risk and support strategic decision-making.
Talk to Our Experts
Accumulation analysis results displayed in Graph by Quarticle, featuring concentric risk zones and detailed hazards analytics. The visualization highlights areas of concentrated exposure and potential regulatory risk, supporting compliance audits and enabling insurers to quickly identify and manage risk accumulations for enhanced underwriting and reporting.
Chat with our agent