Footprint and GeoRisk Analysis on Portfolio and Claims Data

Instantly assess CAT impact and geospatial exposure across your portfolio
From quote to claims, get real-time visibility into hazard footprints, affected exposures, and spatial risk drivers.
Interactive EventHub by Quarticle map showing a large red hazard footprint spreading across a region, used to visualize event impact and exposure in near real time.
Trusted by
EventHUB gives us the ability to understand risk accumulations and event impact in seconds. From underwriting to claims and reinsurance, our teams now rely on live event data to make faster, more confident decisions. No more chasing event maps or manual exposure checks, it just works.
Head of Accumulation, European Reinsurer

Client Success Stories

The largest first insurer in the world reduced costs by 65% and drastically improved performance by replacing their existing GIS solution provider with the Qarta™ geo engine
How the largest first insurer in the world replaced previous solutions with Quarticle’s cloud-native, user-friendly risk assessment suite
Enhancing GIS Performance and Flood Data Management in Europe for the Switzerland-based Global Reinsurance Leader
EventHub footprint visualization in Graph by Quarticle showing a natural disaster event boundary overlaid on a topographic map. The map displays geographic features, representing a spatial risk analysis.

Real-Time Footprint & GeoRisk Analysis for Insurance

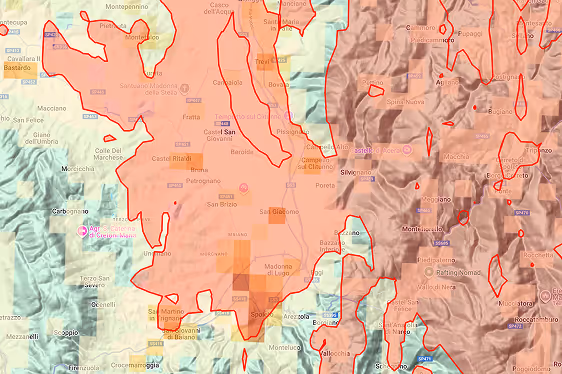
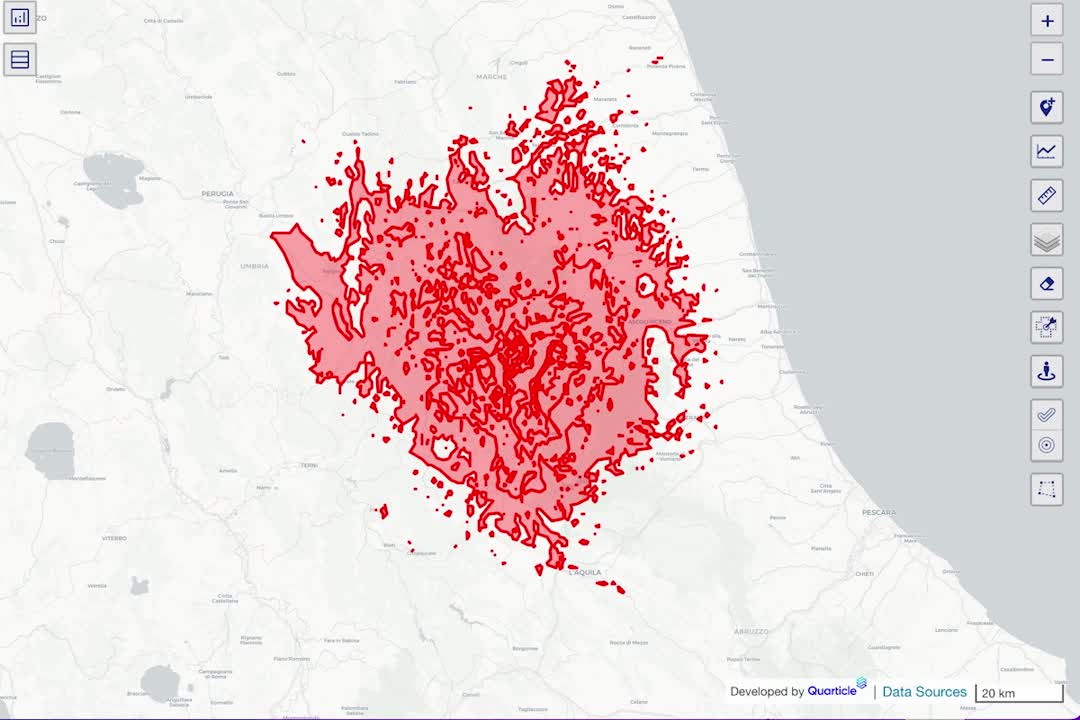
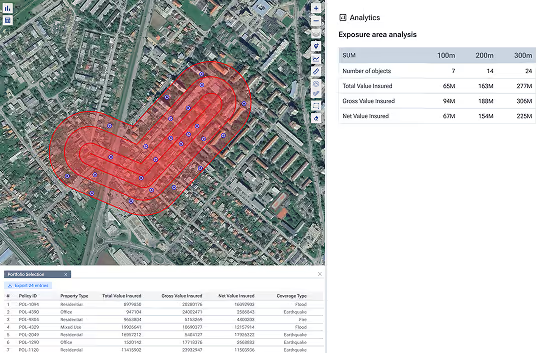
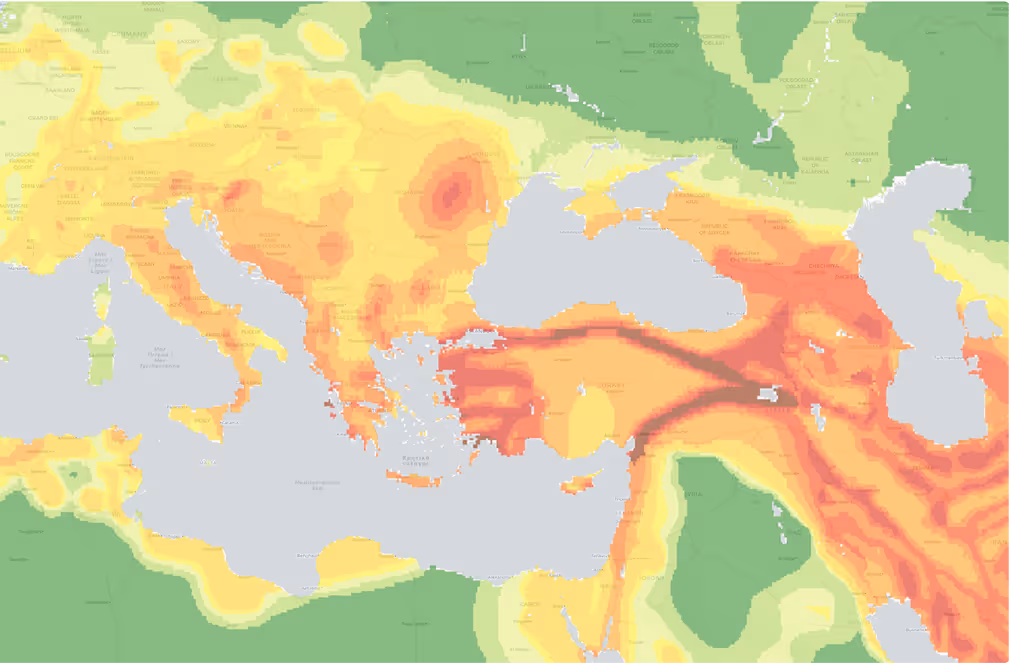
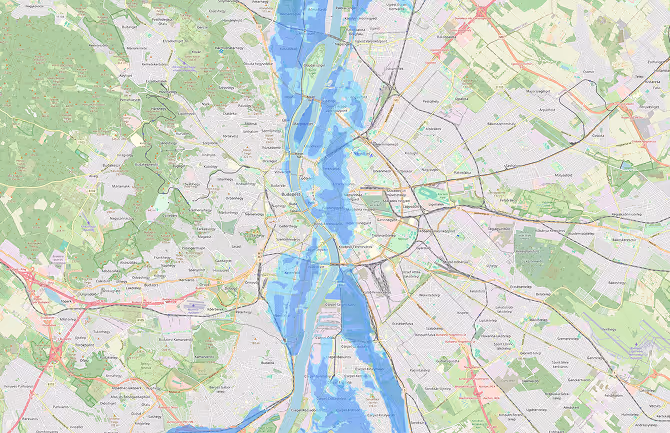
The Footprint and GeoRisk Analysis solution uses EventHUB, Quarticle’s real-time natural-event-capturing data hub, to help insurers understand the spatial relationship between their portfolios and unfolding or historical risk events. Designed to integrate directly into geospatial risk analysis workflows, EventHUB enables underwriters, modelers, and claims handlers to act decisively, within a short period after an event.

What it Delivers
Visualize Event Footprints
Display real-time or historical events footprints directly in Graph, our front-end location intelligence application. Overlay multiple events across time and location to assess risk evolution and track affected zones, all within a single, interactive map interface.
Live Footprint Overlay
Immediately intersect live or historical hazard footprints (e.g., flood zones, wildfire perimeters) with active policies and claims to assess exposure, estimate losses, and trigger early response actions.
Smart Accumulation Checks
Run automated spatial joins to identify risk concentrations in exposed areas. (Supports real-time capital impact estimation)
Claims Triage Intelligence
Prioritize inspections based on policy value, location, and hazard severity. Quickly deploy field teams and simplify claims processing to speed up payouts and reduce the impact on your customers.
Historical Impact Analytics
Use curated, standardized event libraries to analyze past loss events and refine model assumptions, validate pricing thresholds, and strengthen underwriting strategies with real-world impact data.

Key Outcomes for Insurance Teams

Faster loss estimation with event-to-policy joins in seconds
More resilient accumulation control with dynamic event insights
Higher underwriting precision with historical spatial loss intelligence
Improved claims performance via location-based prioritization
Audit-ready traceability of enrichment inputs and decisions

Built for the Demands of Insurance Risk

From real-time catastrophe response to long-term exposure analysis, the Footprint and GeoRisk Analysis on Portfolio and Claims Data solution, powered by EventHUB, gives insurers the agility to act fast and plan smart.

Built to scale with your portfolio and integrate into your existing systems, it ensures that risk, claims, and accumulation decisions are always powered by the most current geospatial intelligence available.

Aerial view of severe flooding with submerged houses, roads, and trees in a residential area.

Who Benefits

Underwriting Teams
Identify concentration risks at quote time. Support smarter selection and pricing strategies.
Claims & CAT Response Units
Rapidly locate affected policies, optimize field team dispatch, and improve early loss estimates.
Risk & Portfolio Managers
Monitor accumulations in real-time and reduce post-event capital shocks.
Reinsurance & Exposure Analysts
Align with reinsurance zones, validate event triggers, and prepare model-ready submission data.
Ready to turn risk events into portfolio insight?
Get real-time visibility to manage exposure and capital with confidence.