Underwriting & Risk Accumulation Control and Reporting

See your risk. Control your exposure. Act with confidence.
Visualize risk in real time, assess exposure across your entire portfolio, and instantly generate audit-ready reports, all in one powerful, interactive environment.
GIS mapping interface showing flood zone and accumulation analysis. Multiple circular markers are scattered across the map, and a light blue polygon shape is highlighted in the center. The interface includes standard mapping controls and different functions on the right side, displayed in Graph by Quarticle.
Trusted by
Quarticle’s geospatial intelligence platform allowed us to harmonize our application landscape. Finally, we can centrally manage all geospatial workflows and drive efficiency and effectiveness across our underwriting workflows. Providing our customers and brokers with these significantly better and faster services not only saves operating costs but also improves our underwriting decisions and increases our margins—it allows us to provide the best-in-class experience to our users.
Former Head of GIS, Global P&C Insurer with 150,000+ Employees

Client Success Stories

The largest first insurer in the world reduced costs by 65% and drastically improved performance by replacing their existing GIS solution provider with the Qarta™ geo engine
How the largest first insurer in the world replaced previous solutions with Quarticle’s cloud-native, user-friendly risk assessment suite
Enhancing GIS Performance and Flood Data Management in Europe for the Switzerland-based Global Reinsurance Leader
Accumulation control analysis in Graph by Quarticle displaying zones of interest as concentric circles. The right panel shows the Point Hazard Lookup functionality, including address information and various risk metrics.

Dynamic Underwriting and Portfolio Intelligence

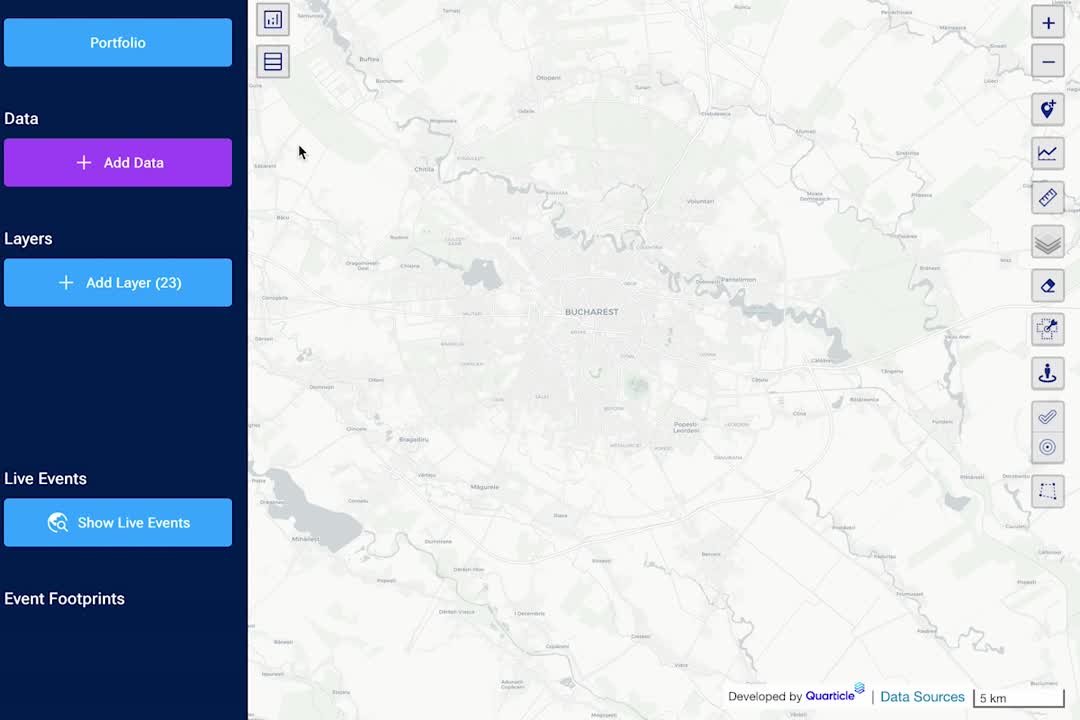
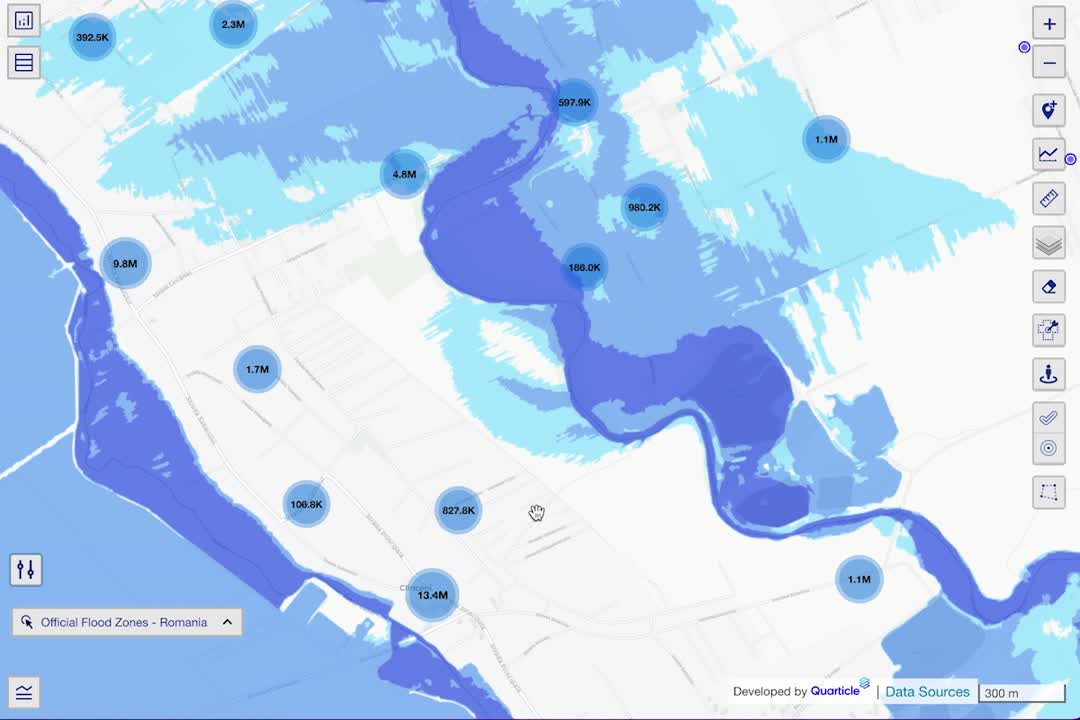
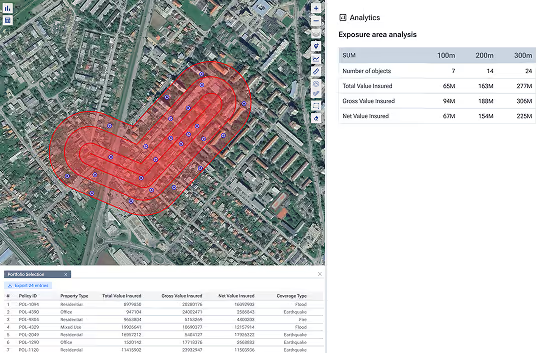
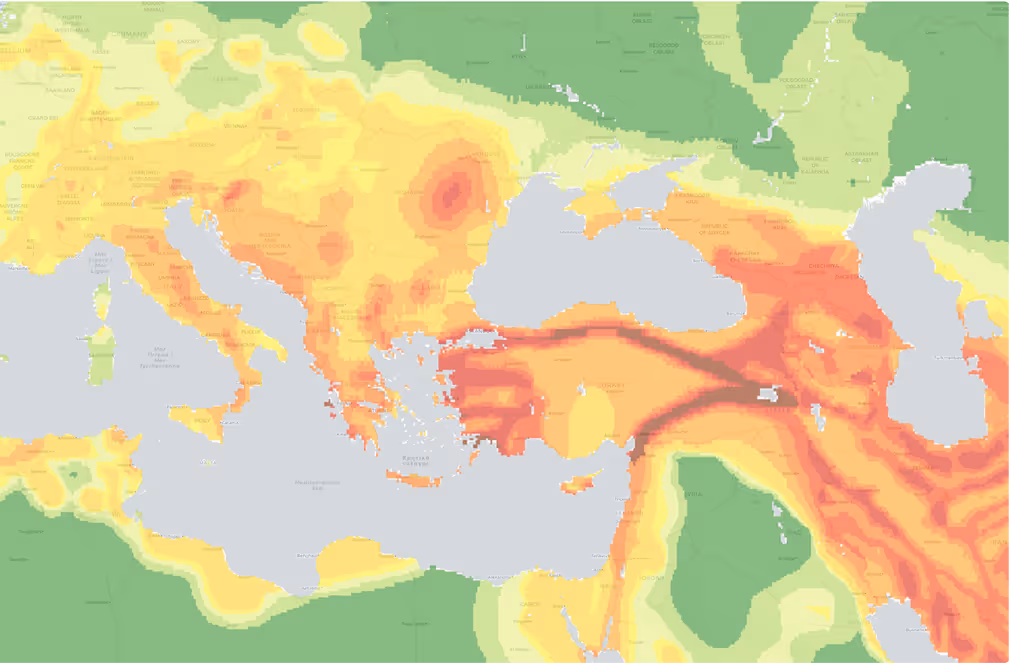
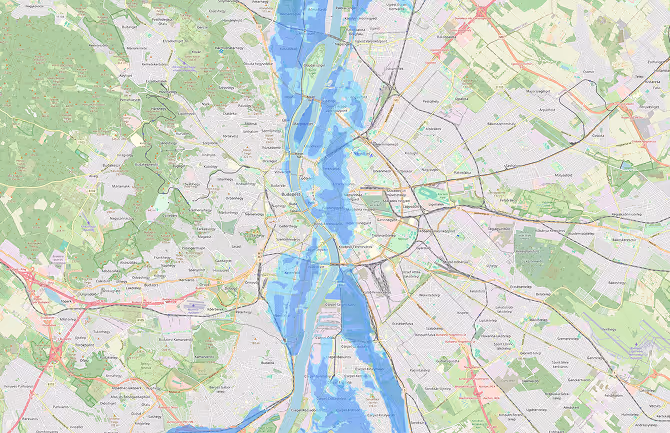
Our Underwriting and Risk Accumulation Control solution combines dynamic risk analysis, live portfolio visualization, and automated reporting in one seamless experience, eliminating delays and improving clarity across underwriting and portfolio teams.

Designed to Solve Core Insurance Challenges:

problem
Blind spots in exposure
solution
Easily identify and manage accumulations by geography, hazard type, or portfolio structure before they become a problem.
problem
Disconnected systems
solution
Integrate risk, location, and portfolio data into one view. No more toggling between tools or waiting for static reports.
problem
Slow, manual workflows
solution
Accelerate underwriting decisions with instant access to spatial risk data, enrichment layers, and modeling outputs.
problem
Compliance & reinsurance reporting pressure
solution
Generate detailed, structured accumulation reports that meet regulatory and partner requirements in minutes.
What it delivers
Instant visibility into accumulation risk
Visualize policy-level exposure on interactive maps with configurable layers for peril type, total insured value, policy class, and more. Drill into high-risk zones and identify concentrations at a glance.
Real-time accumulation analysis
Run radius, polygon, or proximity-based checks on demand with no deep GIS expertise needed. Whether you’re evaluating a new quote or reviewing an entire book, you get insights in seconds.
Dynamic scenario planning
Overlay live or historical hazard data—like floods, wildfires, or storms—on your active portfolio to evaluate event impact.
Smart alerts and exposure thresholds
Define custom rules to flag overexposure by region, peril, or policy group - helping you stay ahead of risk before it compounds.
Automated reporting for compliance and reinsurance
Export insights in CSV or PDF formats for internal reviews, reinsurer communication, or regulatory submissions. Fully audit-ready, with no manual formatting required.

Key Outcomes for Insurance Teams

Confident underwriting with real-time spatial risk visibility
Faster exposure analysis across all lines of business
Reduced effort in generating compliance reports
Better preparedness for CAT events through dynamic scenario analysis
An image showing a geographic layer overlaid by an accumulation analysis in Graph by Quarticle. The right panel displays an analytics window with accumulation results and statistical data presented in a tabular format.

Engineered for High-Scale Insurance Workflows

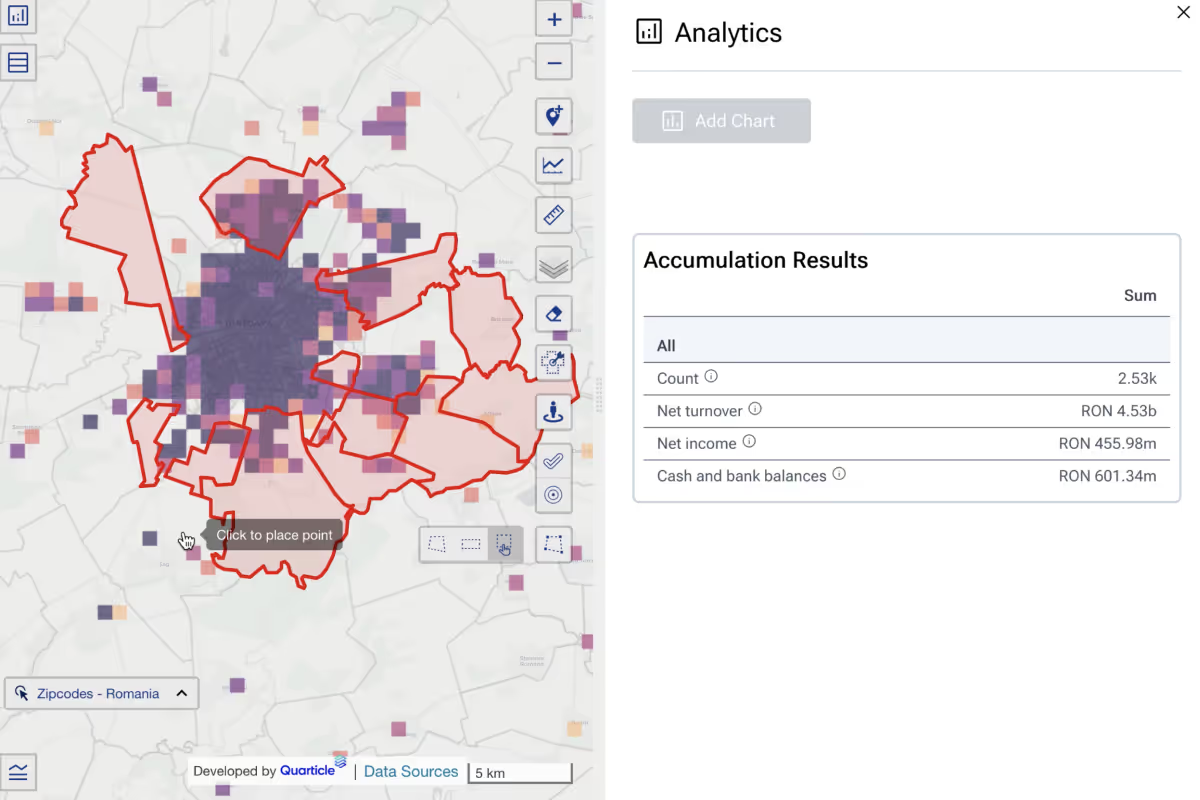
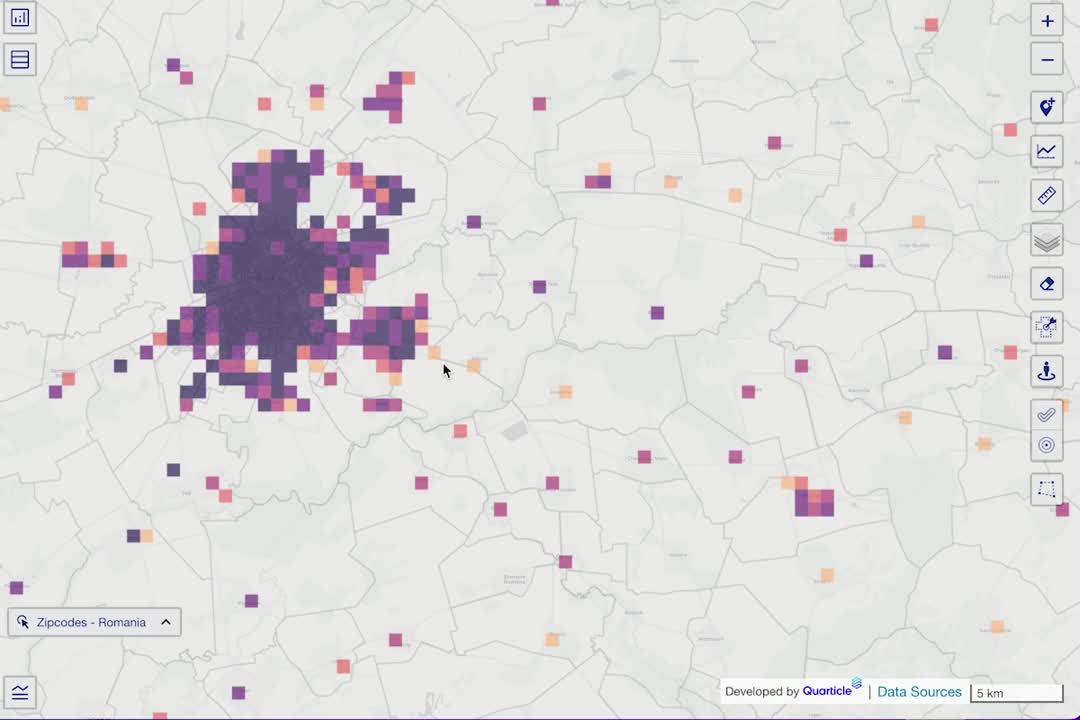
Designed to work at the scale of today’s insurance business, from specialty underwriters to global reinsurers. The system handles millions of policies, integrates with your existing tools, and delivers results in seconds instead of hours, so you get the full picture fast.

Who Benefits

Underwriters & Pricing Analysts
Access real-time spatial risk intelligence and exposure, enabling faster, smarter underwriting decisions.
Risk Managers & Accumulation Analysts
Continuously monitor and report aggregated exposures with clarity. Identify risk concentrations early.
Portfolio Managers & Executives
Gain portfolio-wide visibility into trends, hotspots, and capital-at-risk to guide strategic decisions and reduce volatility.
Compliance & Reinsurance Teams
Automate reporting for regulators and reinsurers with audit-ready insights, ensuring transparency, accuracy, and alignment with internal or external requirements.
Want to take control of accumulation risk?
Strengthen underwriting decisions through real-time risk insights.