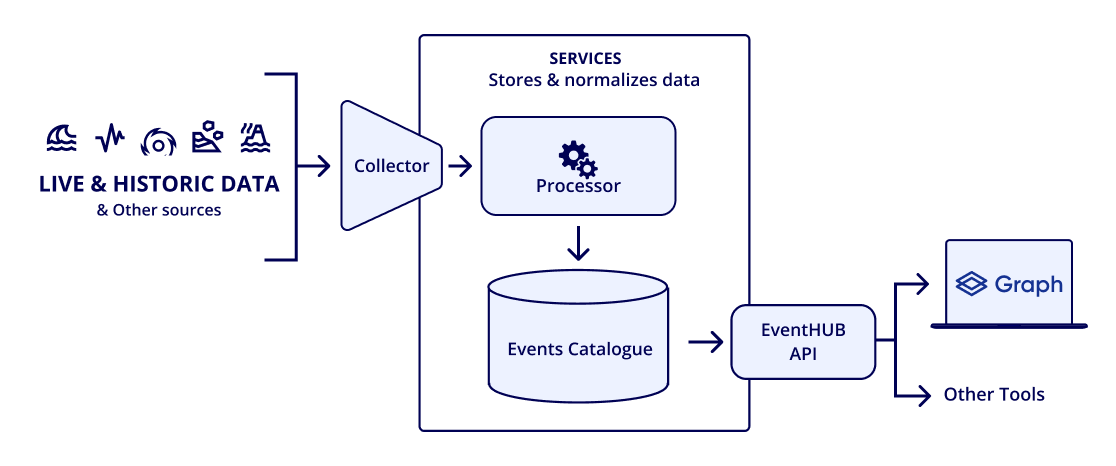
Logo EventHub

Real-Time Natural-Event-Capturing Data Hub

Turn live risk data into actionable insights instantly, accurately, and with full portfolio context.

EventHUB empowers insurers and reinsurers to visualize, analyze, and respond to natural disasters in real time with standardized, spatially enriched event footprints ready for accumulation control, claims response, and portfolio optimization.

Download Product Brief

How EventHUB Works

EventHub by Quarticle data processing architecture diagram displaying the complete workflow from data collection to API delivery.

Client Success Stories

The largest first insurer in the world reduced costs by 65% and drastically improved performance by replacing their existing GIS solution provider with the Qarta™ geo engine
How the largest first insurer in the world replaced previous solutions with Quarticle’s cloud-native, user-friendly risk assessment suite
Enhancing GIS Performance and Flood Data Management in Europe for the Switzerland-based Global Reinsurance Leader
Built for Insurance Workflows
Insurers use EventHUB to:

Underwrite with Greater Precision

Leverage decades of hazard footprints to price more accurately, assess risk concentrations at quote time, and strengthen selection strategies.

Get Faster Claims Response

Immediately identify impacted policies post-event, prioritize high-severity claims, and speed up response with location-based clarity.

Seamless Accumulation Analysis

Run exposure checks the moment a catastrophe strikes, minimizing capital exposure and supporting compliance with solvency frameworks.

Improve Catastrophe Model Accuracy with Real Event Footprints

Feed standardized, geospatially enriched event data into internal models to improve predictive power and validate assumptions.

Deeper Portfolio Analysis with Qarta™

When combined with Qarta™, Quarticle’s cloud-native geo-intelligence engine, you can take your analysis a step further. Qarta™ allows you to utilize EventHUB’s real-time event footprints for in-depth portfolio impact analysis, enabling you to assess exposure more quickly and make informed decisions during critical events.

Risk analysis presented in Graph using EventHub by Quarticle, showing a natural disaster footprint visualization with red and blue shaded areas representing different hazard intensity zones overlaid on a base map. The analytics panel displays accumulation results.
Footprint accumulation analysis in Graph using EventHub by Quarticle, displaying a catastrophic event boundary and high-impact area. On the right, the interface shows detailed footprint accumulation data, along with the final accumulation results summary.

See Portfolio Impact in Graph

Access footprints directly in Graph, our cloud-based location intelligence application, where you can visualize events, intersect them with your portfolios, and export enriched outputs to share with your stakeholders.

What it delivers
Built for Your Stack
EventHUB’s REST API and GeoJSON output format make it easy to plug into existing GIS platforms, modeling tools, or in-house dashboards. No black boxes. No vendor lock-in. Just clean, normalized event data delivered exactly where you need it.
Real-Time Portfolio Awareness
As soon as a hazard footprint is published, EventHUB lets you instantly measure the impact on your assets, policies, or reveal exposure zones in your Qarta™’s Portfolio. Whether you’re preparing a claims response or checking for accumulation breaches, you get fast, geospatial clarity at every layer of severity.
Clean, Normalized, Ready-to-Use Data
EventHUB transforms diverse, messy hazard inputs into a common format using JSON and geospatial standard files. These are instantly usable in QGIS, GeoServer, or your risk engine, no postprocessing required.
Event Archives with Full Traceability
Access a persistent archive of past event footprints to calibrate models, underwrite with context, and build defensible pricing strategies. Every event comes with metadata, version history, and full traceability.
Enterprise-Grade Security
EventHUB uses encrypted JSON Web Tokens (JWTs) for secure authentication and access. All API calls are logged and auditable, ensuring data integrity, user accountability, and operational confidence.

Who Benefits

Insurers
Pre-underwrite individual risks and portfolios by referencing historical natural hazard events, enhancing pricing accuracy, and risk selection.
Reinsurers
Run real-time accumulation checks after every catastrophe to monitor exposure and support capital allocation decisions.
Claims Handlers
Quickly assess affected areas and determine exposure immediately after an event to prioritize claims processing and response.
Underwriters
Access on-demand hazard footprints to support dynamic underwriting decisions and proactively assess risk concentrations.
Risk Modelers & Analysts
Automate event-driven modeling pipelines using normalized, high-quality geospatial data for consistent and scalable analysis.
Catastrophe Modelers
Ingest real-time and historical footprints into simulation workflows for more accurate post-event loss estimation and model validation.
Disaster Management Agencies
Access immediate geographic impact data to coordinate response efforts, allocate resources, and support community resilience.
Ready to gain real-time event awareness?
Experience a smarter way to assess risk and respond to catastrophe.