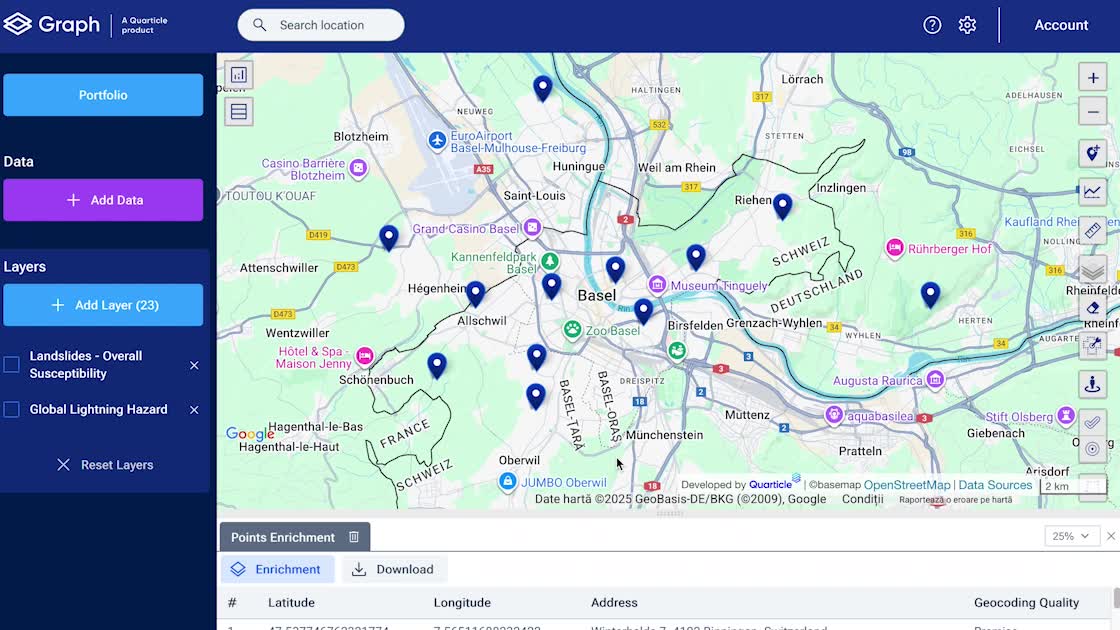
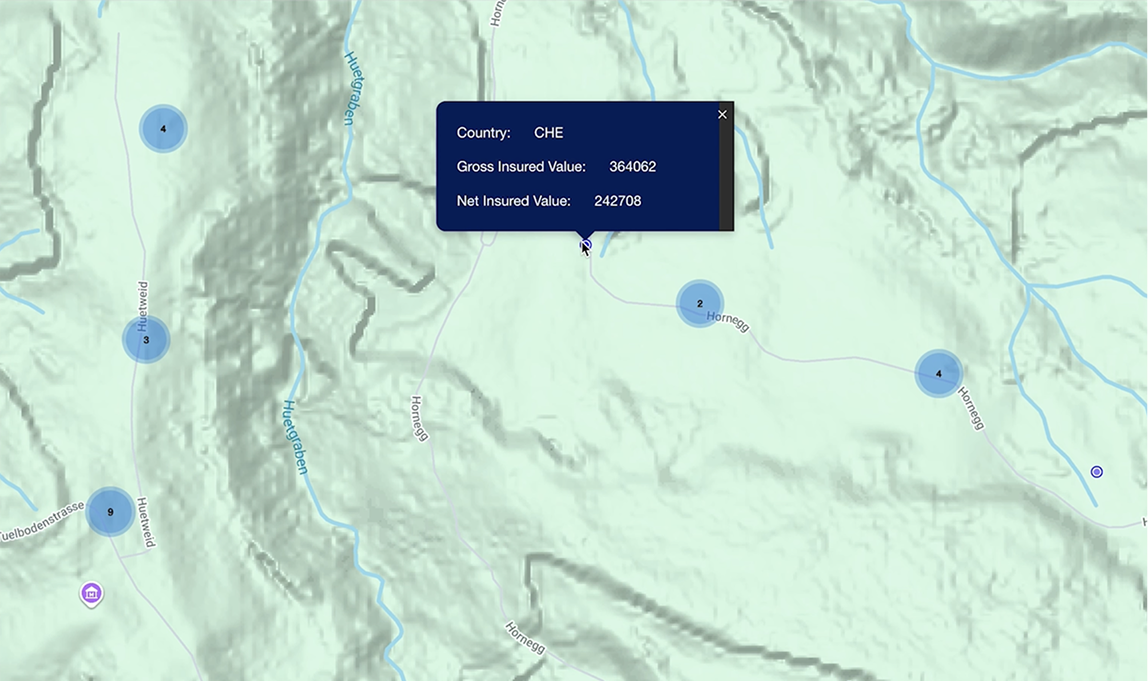
Graph unifies distributed geospatial data for spatial pattern exploration and advanced geographic analysis. Powered by the Qarta™ GeoIntelligence engine for fast performance on complex datasets, Graph satisfies the performance and accessibility needs of technical and business teams alike.
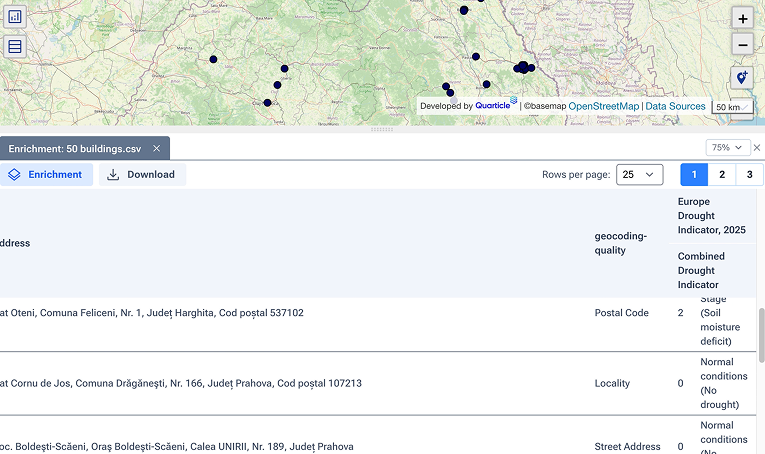
Validate and enrich large location datasets automatically
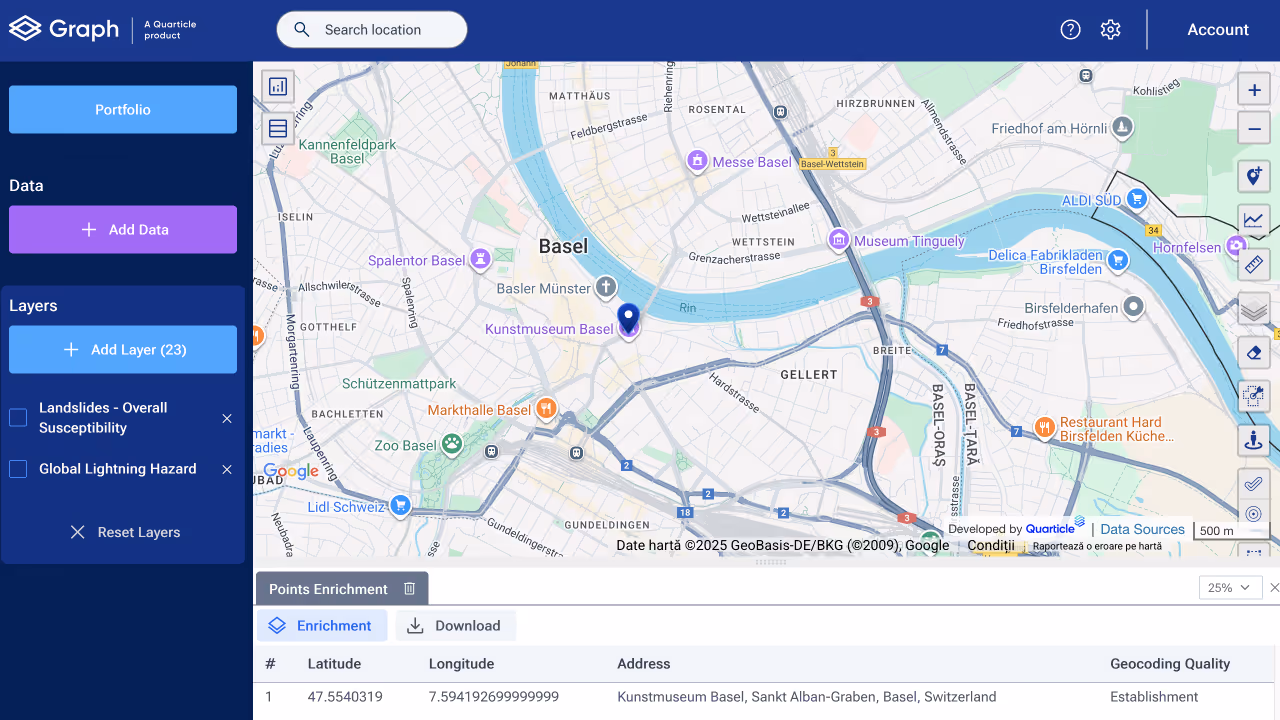
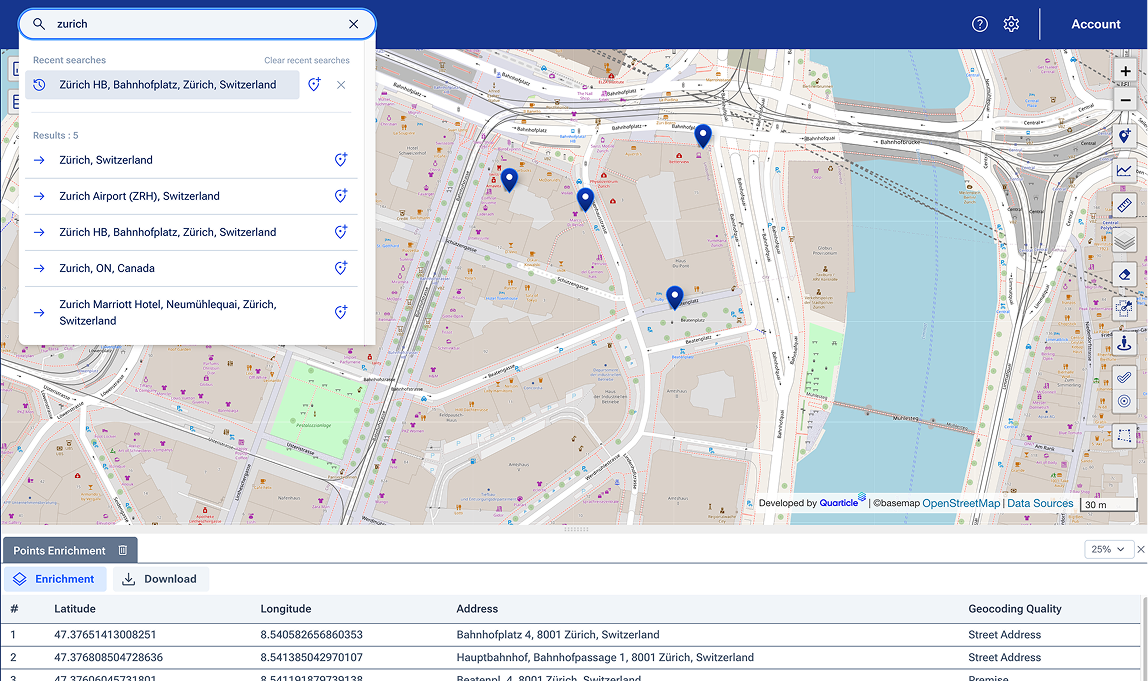
Geocode and reverse geocode for address validation
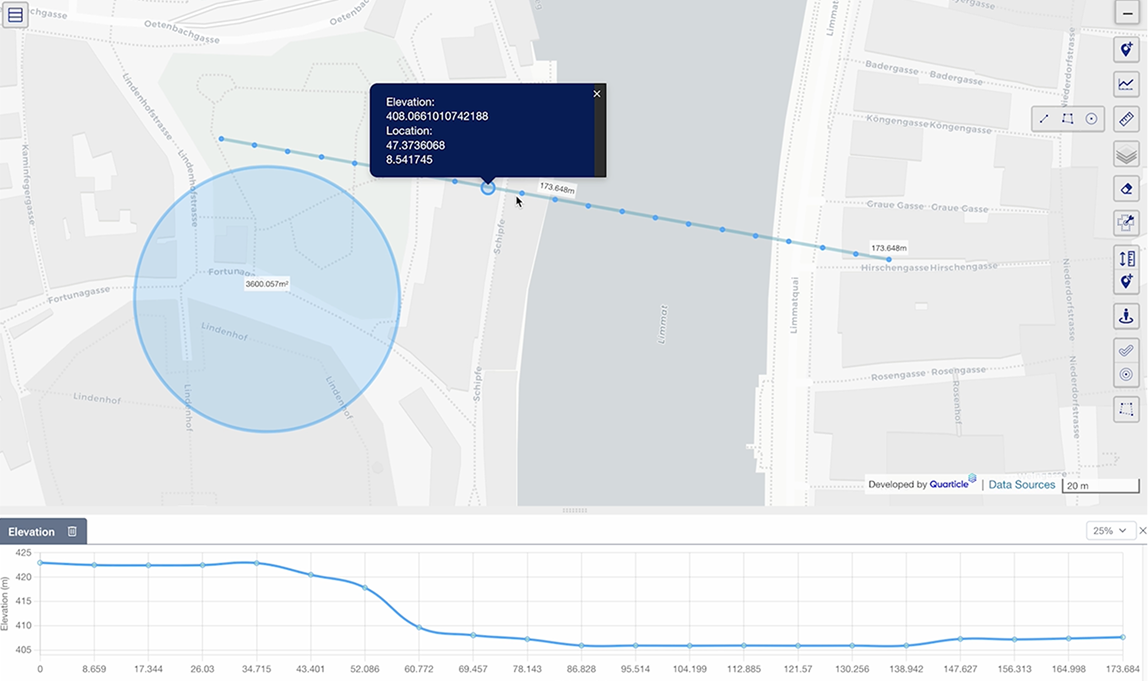
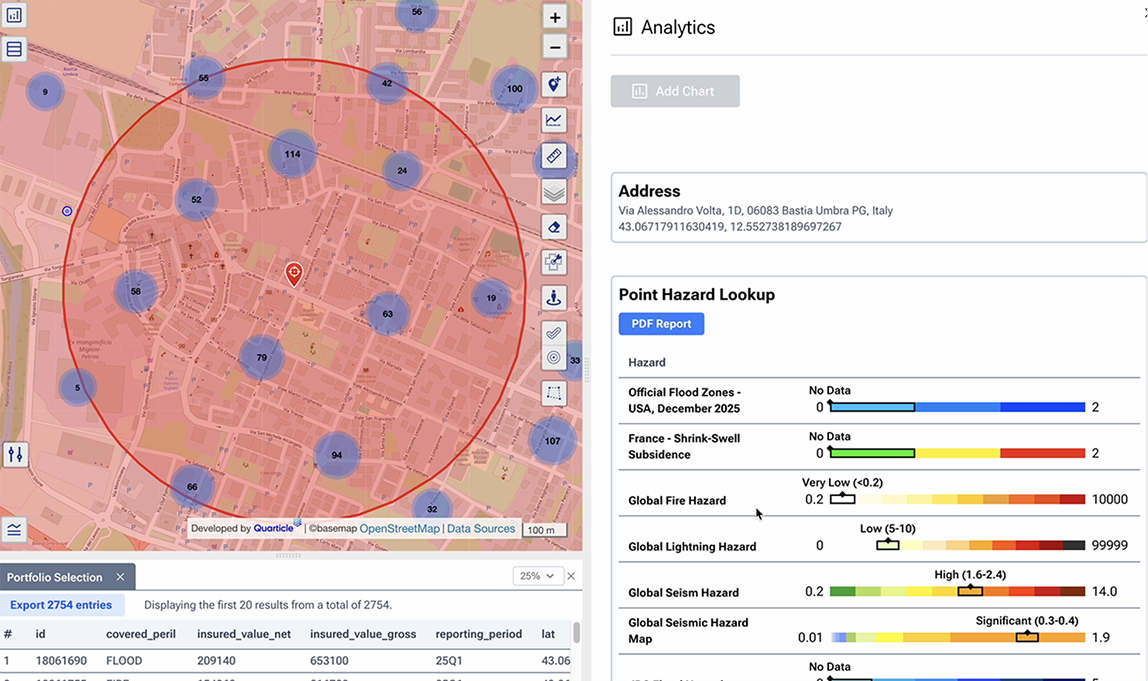
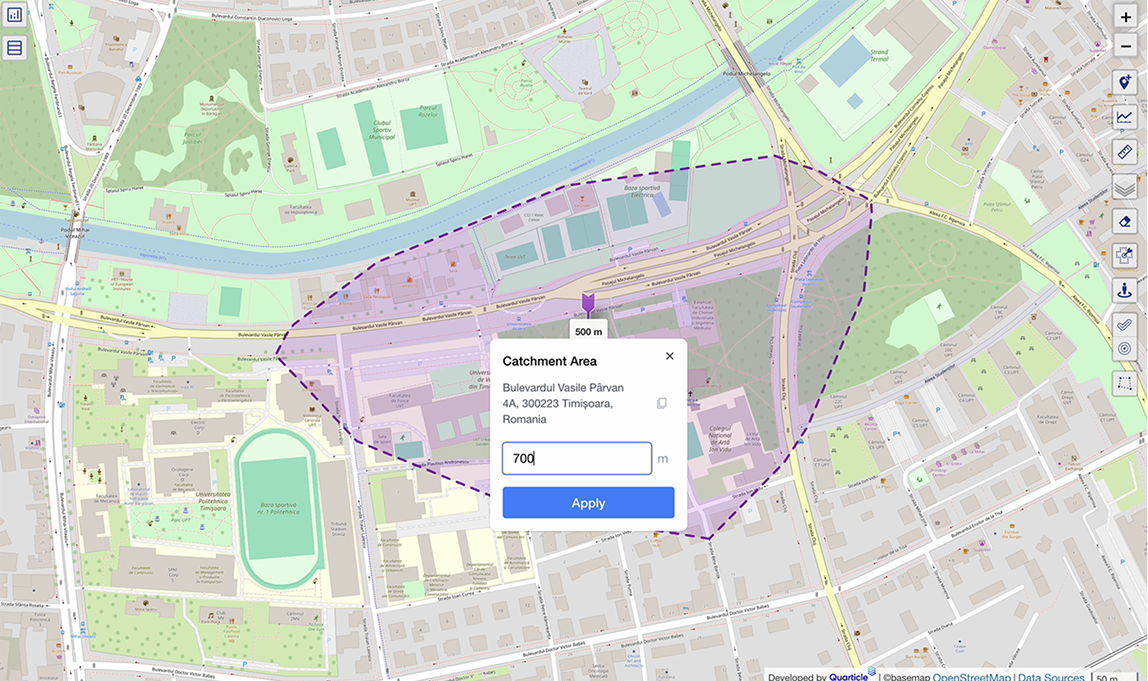
Analyze proximity, reach, and geographic influence
Import and export enriched datasets in standard formats
Seamless Data Integration
Works with common data formats (tables, vectors, rasters)
Supports industry-standard map services (OGC)
Integrates directly with Databricks Notebooks and BI tools
Works with existing data and reporting workflows
Secure Collaboration
Share interactive maps and analyses via links or embeds
Control access using roles, permissions, and layer-level visibility
SSO integration (Azure AD + others) for seamless authentication
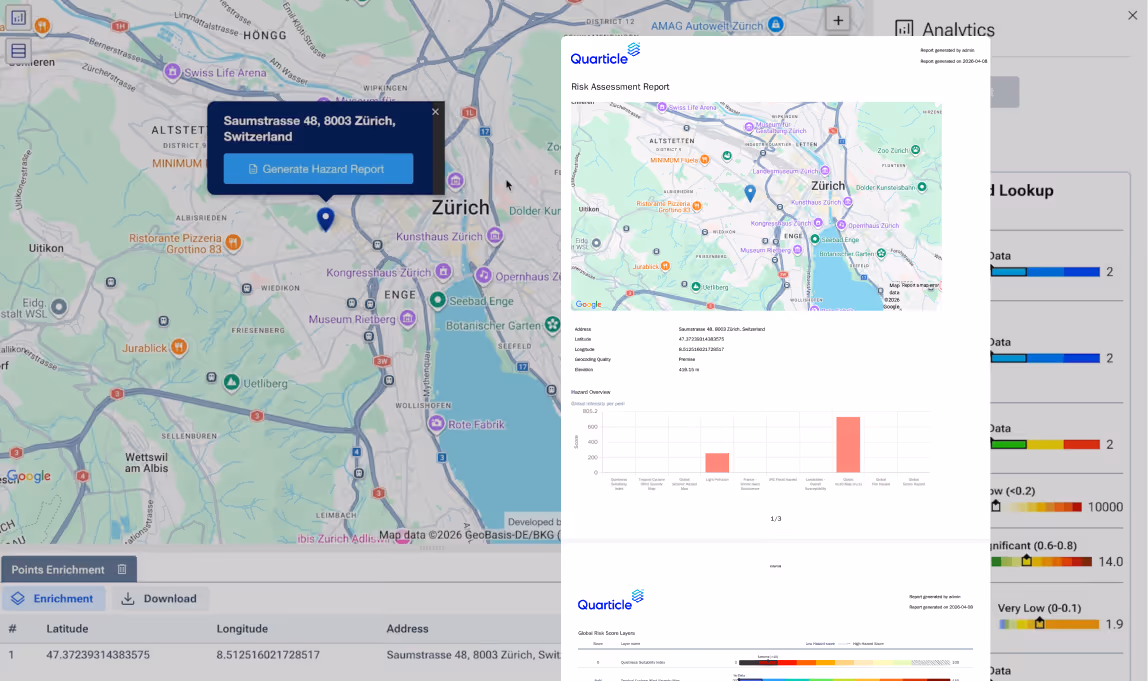
Export analysis results as professional CSV or PDF reports
Enable API-based access for controlled automation
Accessible and Built for Scale
Web-based, no installation required
Accessible from any device with an internet connection
Fast performance on large and complex datasets
Configurable to match organizational standards
Quarticle Ecosystem Integration
High-Performance GeoIntelligence Foundation
Graph is powered by Qarta™, Quarticle’s GeoIntelligence engine. This allows users to explore, analyze, and visualize geospatial data without waiting for long processing times.
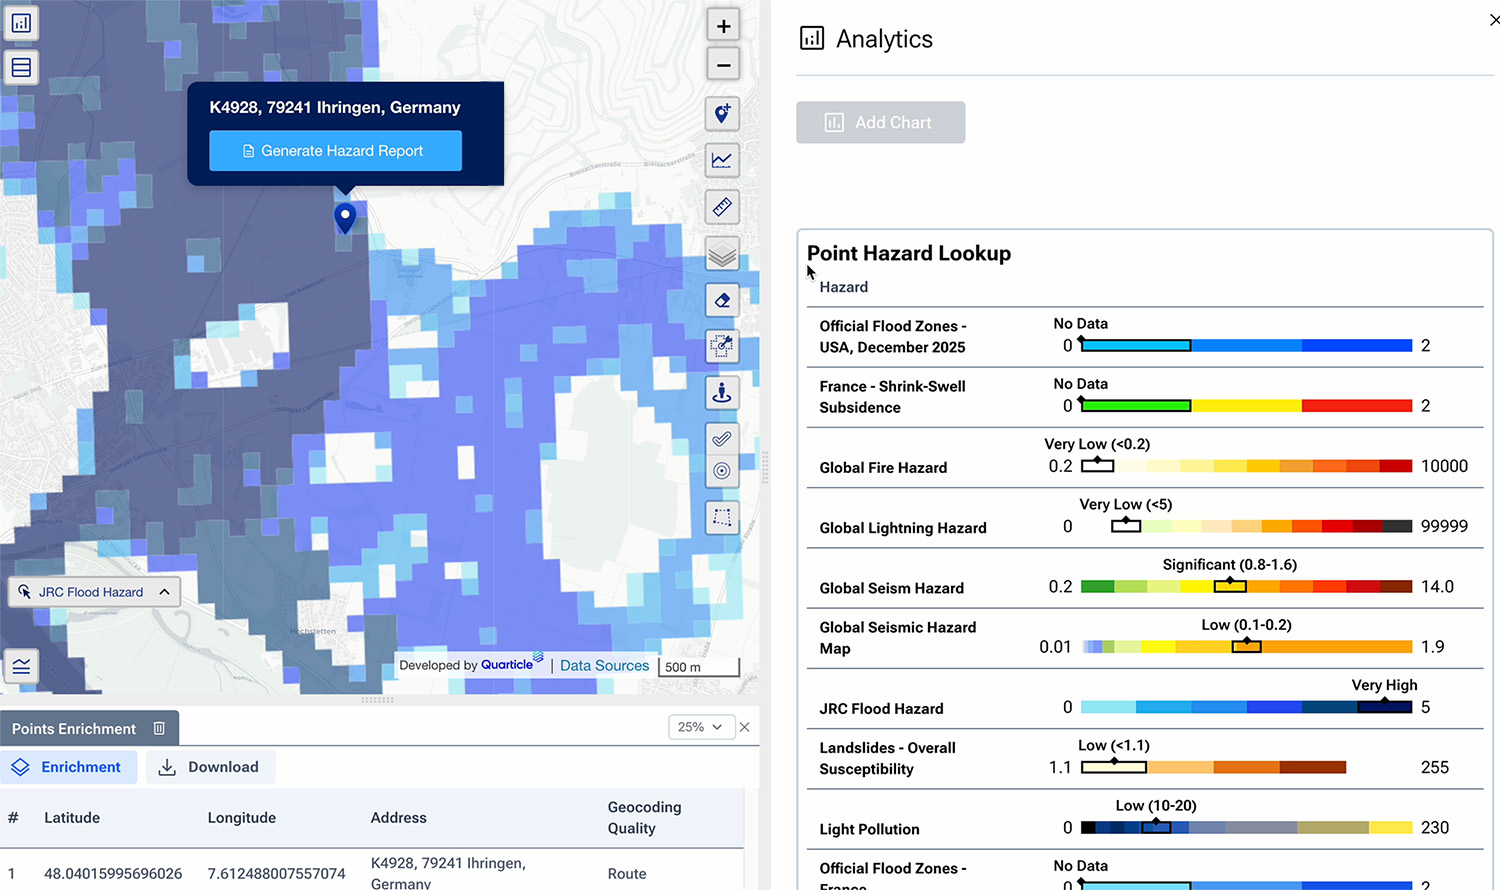
Live Event & Context Intelligence
Graph connects directly to EventHub, providing access to live and historical event footprints that can be overlaid instantly on maps and datasets.
AI-Assisted Exploration & Analysis
Graph includes built-in AI integration (GraphAI) that makes spatial analysis more accessible and interactive.
Embedded Visualization Anywhere
Graph’s capabilities are also available through Graph Light, an embeddable version designed for seamless integration into other applications.
Proven Value
Unifies Siloed Data:
Tables and maps come together instantly for spatial insight
Works For Non-GIS Users:
Intuitive visual exploration without specialized training
Performs At Scale:
Fast queries and responsive analysis powered by Qarta™
Meets Enterprise Standards:
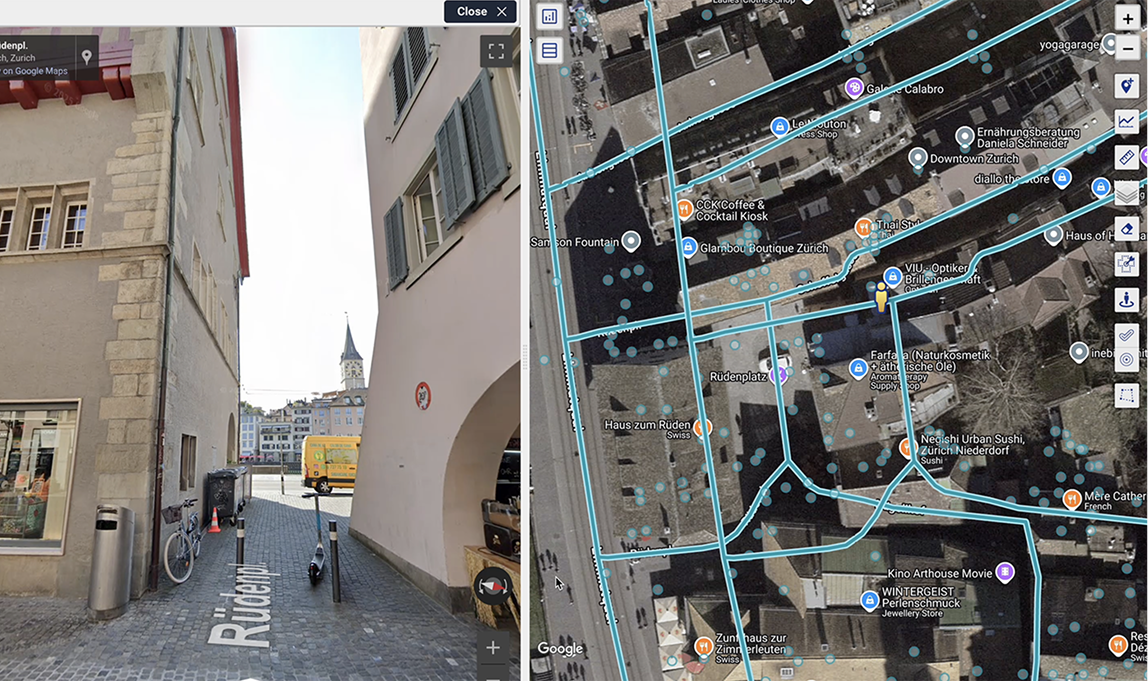
OpenStreetMap, Google, Bing, and OGC services
Easy to Share and Export:
Brand-compliant CSV and PDF outputs with secure sharing
Built For Enterprise Use:
Roles, SSO, auditability, and scalable architecture
How we compare
Feature
Deployment
Performance
Accessibility
Data Formats
Collaboration
Integrations
Scalability
Graph
Zero-install web app
Qarta™ instant queries
Any device, anywhere
10+ (CSV/shp/DB/raster)
Secure sharing + SSO
Databricks/PowerBI/MCP
Enterprise datasets
Traditional Platforms
Heavy desktop install
Slow on large data
Desktop only
Limited imports
File sharing
Limited APIs
Workstation limits
Basic Web Mapping
Browser-based
Basic rendering
Limited mobile
Basic CSV/JSON
Basic embeds
Basic APIs
Small datasets
How we compare
Deployment
Graph
Zero-install web app
Traditional Platforms
Heavy desktop install
Basic Web Mapping
Browser-based
Performance
Graph
Qarta™ instant queries
Traditional Platforms
Slow on large data
Basic Web Mapping
Basic rendering
Accessibility
Graph
Any device, anywhere
Traditional Platforms
Desktop only
Basic Web Mapping
Limited mobile
Data Formats
Graph
10+ (CSV/shp/DB/raster)
Traditional Platforms
Limited imports
Basic Web Mapping
Basic CSV/JSON
Collaboration
Graph
Secure sharing + SSO
Traditional Platforms
File sharing
Basic Web Mapping
Basic embeds
Integrations
Graph
Databricks/PowerBI /MCP
Traditional Platforms
Limited APIs
Basic Web Mapping
Basic APIs
Scalability
Graph
Enterprise datasets
Traditional Platforms
Workstation limits
Basic Web Mapping
Small datasets
What our customers are saying
“Quarticle’s Graph platform is intuitive, reliable, and easy to use. Our teams work more efficiently and confidently, enabling stronger underwriting decisions.”
Chief Claims Officer for a large Italy-based Insurer
Ready to analyze geospatial data interactively?
Gain precise insights with cloud-based location intelligence.