GeoIntelligence Use Cases for Public Administration

Looking to connect spatial data with public services, infrastructure, and operational workflows? Explore key public administration use cases powered by Quarticle’s GeoIntelligence platform.

1. Citizen Engagement & Local Issue Management

Give citizens a simple way to report local problems and administrative teams a centralized environment to organize, assign, track, and resolve them. Location-based reporting helps route issues to the right departments and provides visibility throughout the process.
ReQuest logo
Map visualization in Graph by Quarticle showing multiple hazard layers overlaid with portfolio locations. The interface displays hazard intensity zones and an analytics panel summarizing exposure values for different natural hazards.

2. Infrastructure & Asset Management

Manage roads, public buildings, utilities, and other public infrastructure using a shared geographic view of assets and their condition. Identify assets requiring attention, prioritize maintenance, and support more efficient infrastructure planning.
Graph logoQarta logo
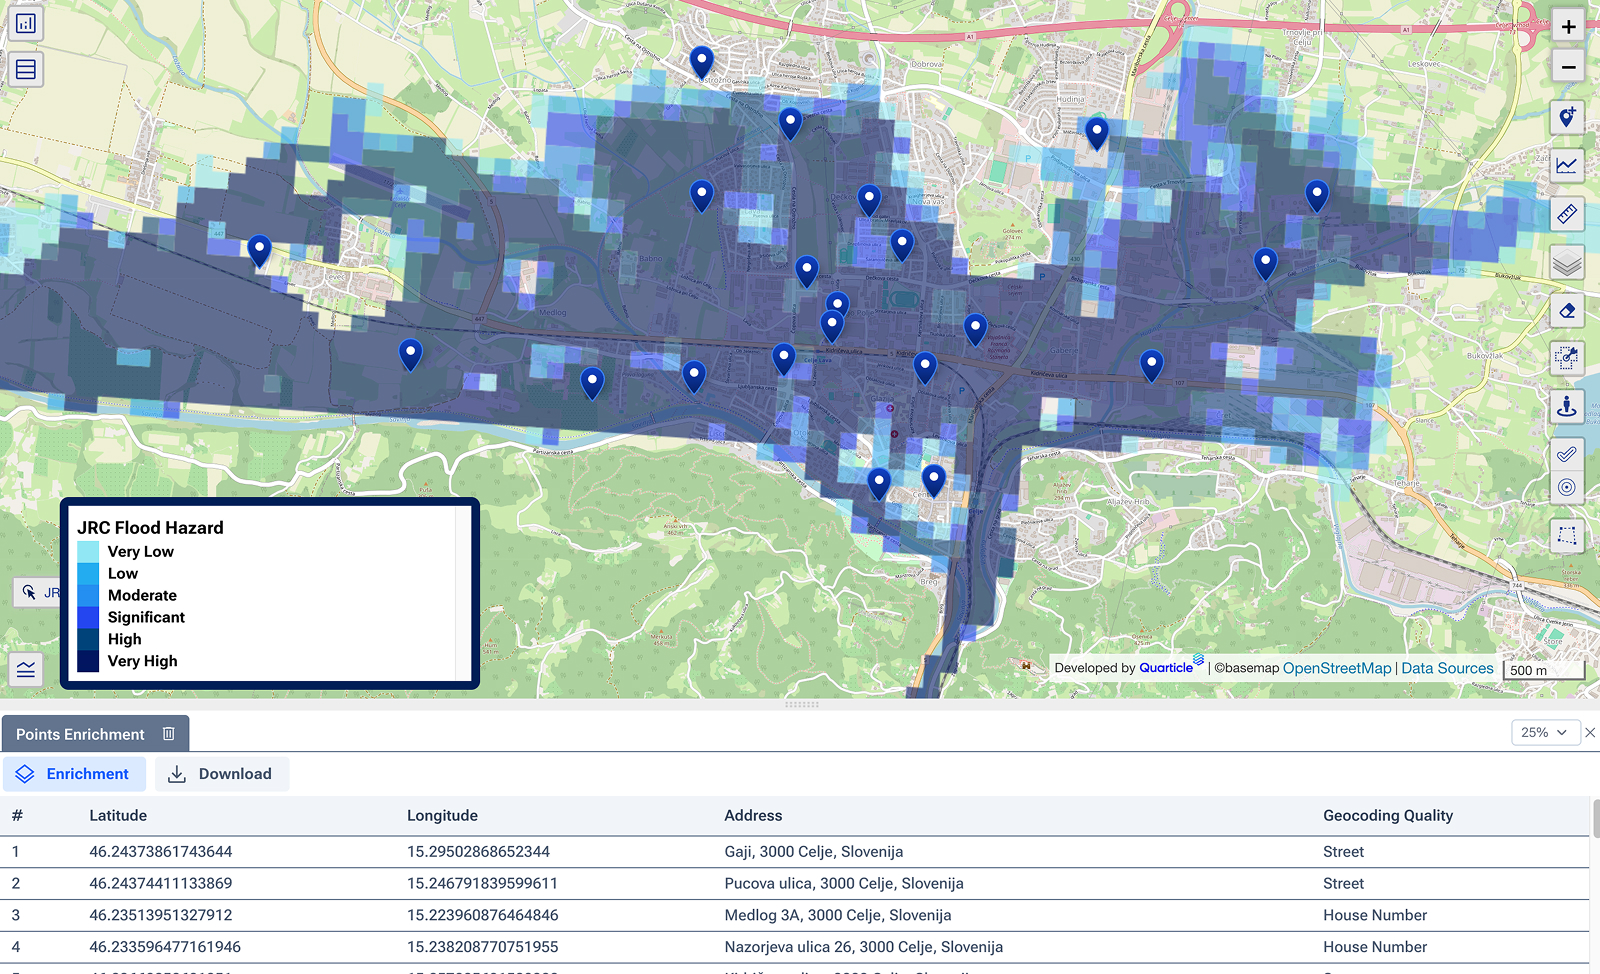
Flood exposure map in Graph by Quarticle showing high-risk flood zones over a river basin. Blue-shaded areas indicate varying flood depths and risk levels, while a property-level data table lists exposed assets below.

3. Planning, Land Use & Permitting

Support development decisions by combining cadastral, environmental, infrastructure, zoning, and other planning data. Assess existing conditions, identify development constraints, and evaluate the spatial impact of proposed projects before approving permits.
Qarta logoGraph logo
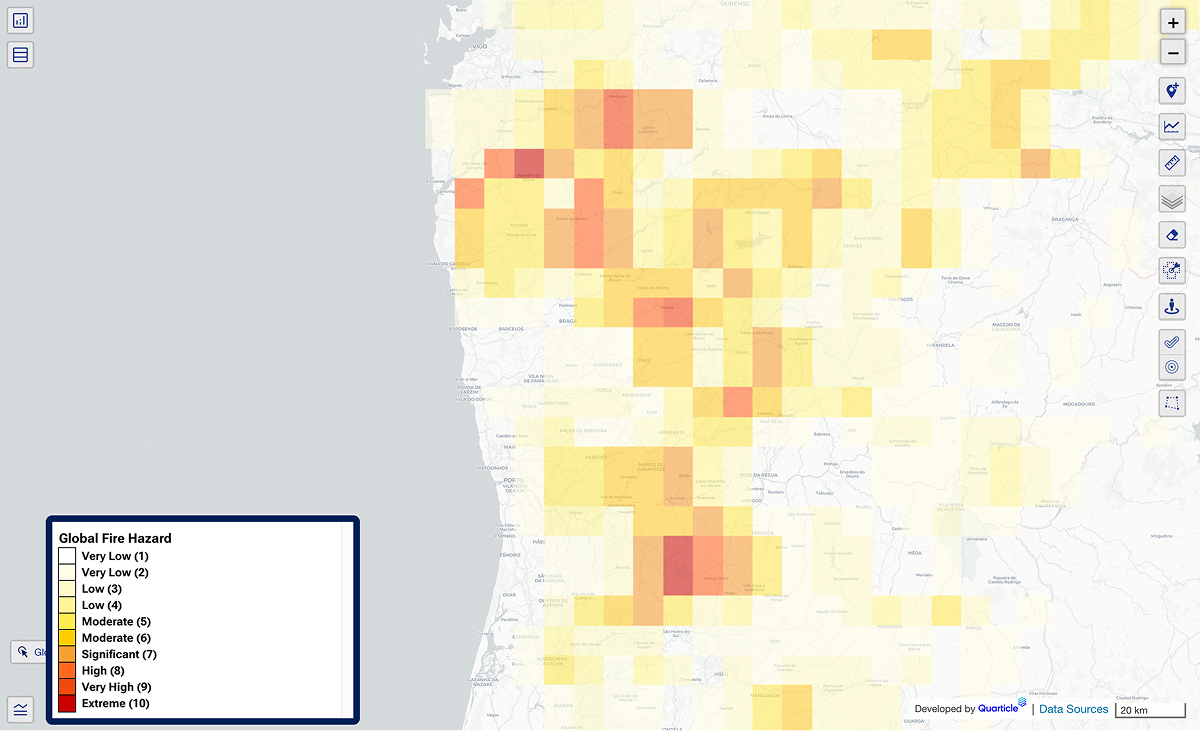
Geographical layer in Graph by Quarticle displaying global fire hazard across a region. Darker orange and red areas highlight higher fire risk, while lighter shades show less exposed areas.

4. Climate Risk & Resilience Planning

Support long-term adaptation planning by assessing how climate risks could affect communities, infrastructure, land, and public services. Identify vulnerable areas and prioritize where investments and resilience measures are needed most.
Qarta logoRAPID logoGraph logo
Seismic hazard map in Graph by Quarticle illustrating earthquake exposure intensity across a region in Romania. Color gradients indicate varying seismic risk levels, with mapped portfolio points showing exposed locations.

5. Flood Monitoring & Risk Management

Monitor flood hazards and developing flood events by combining hazard data, live event information, infrastructure, and population data. Identify potentially affected areas and assets to support preparedness, response planning, and recovery.
EventHUB logoGraph logo
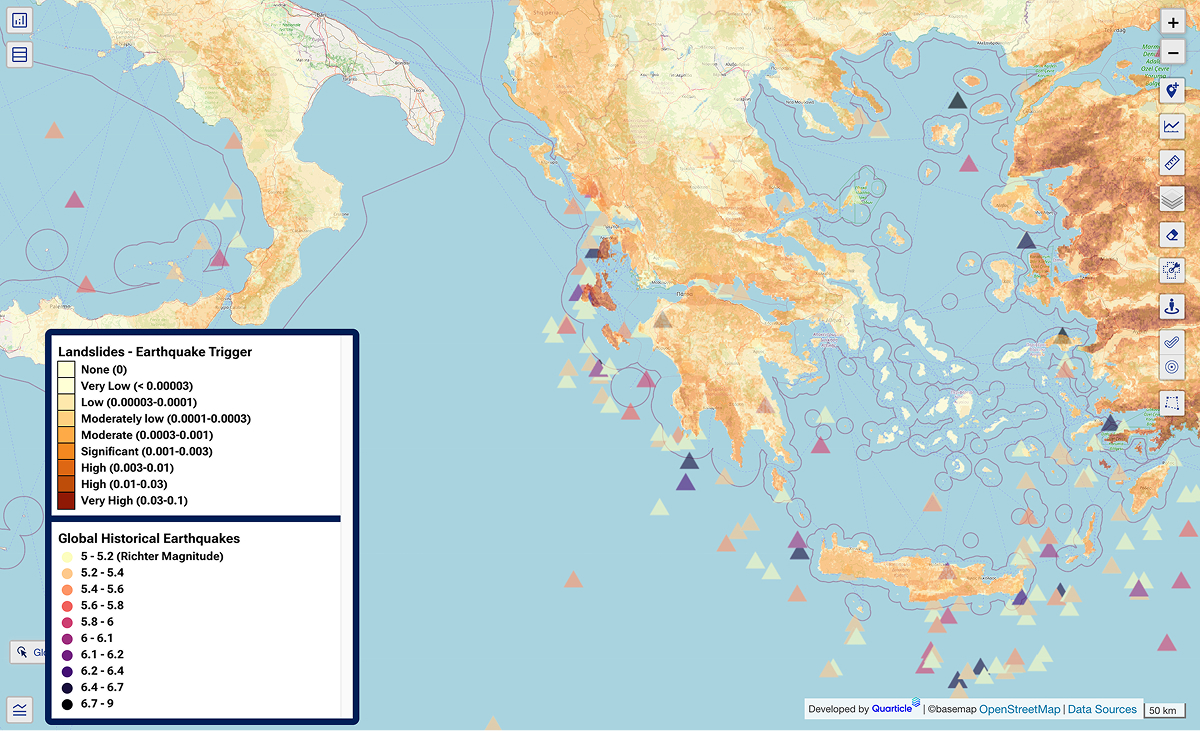
Comprehensive multi-hazard map in Graph by Quarticle combining landslides and earthquake layers over a regional base map. Symbols and colored overlays depict overlapping risk zones for integrated climate adaptation analysis.

6. Wildfire Monitoring

Monitor wildfire conditions using predicted fire probabilities, satellite data, and near-real-time event information. Identify exposed communities and infrastructure and give operational teams an up-to-date view of developing fires.
EventHUB logoGraph logo
Highlighted map area displaying accumulated event footprints, with visual indicators for damage extent and severity, property valuations, and calculation results that support rapid claims processing, all enabled by EventHub and shown in the Quarticle Graph interface.

7. Early Warning & Emergency Response

Support emergency teams before and during critical events by bringing forecasts, alerts, live event information, infrastructure, population, and operational data into a shared geographic view. Help teams assess impacts, coordinate response, and make faster decisions as situations develop.
EventHUB logoGraph logo
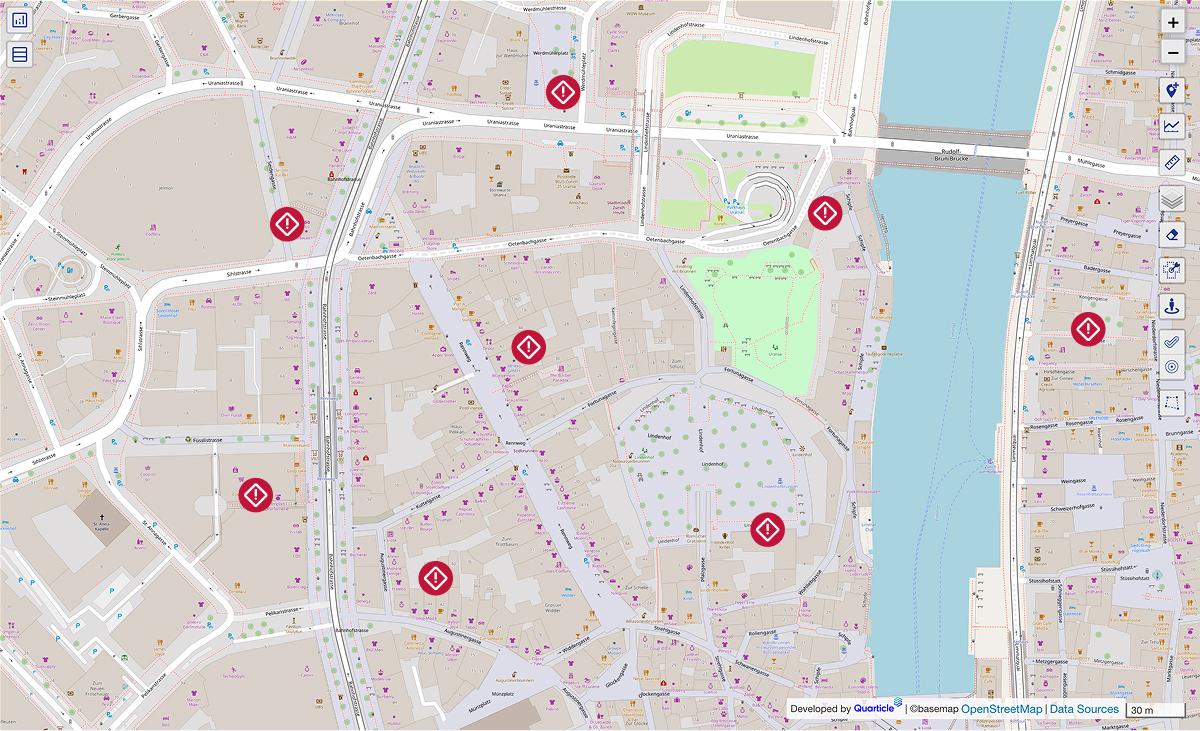
An urban hazard forecast map with hazard markers indicating early warning sites across a city, visualized for proactive risk management in Graph by Quarticle.

8. Accessibility & Public Service Planning

Assess whether citizens have adequate access to essential public services such as schools, healthcare, social services, public transport, waste collection, and administrative offices. Combine population, service locations, and travel-time data to identify gaps in service coverage and support decisions on where resources and services are needed most.
Qarta logoGraph logo
Map visualization in Graph by Quarticle presenting a global seismic hazard layer with risk zones depicted in color gradients; multiple live event markers highlight recent seismic activity for real-time catastrophe monitoring and multi-peril response.

9. Environmental Monitoring & Compliance

Monitor environmental conditions and land-use changes using satellite imagery, environmental data, administrative boundaries, and other spatial information. Detect and investigate activities such as unauthorized construction, illegal land-use changes, and unpermitted waste sites.
Qarta logoGraph logo
Agricultural risk and land use map in Graph by Quarticle featuring diverse land classification overlays, and highlighted regions, designed for specialty lines support and climate monitoring across agricultural sectors.

10. Land & Cadastral Data Management

Manage cadastral, property, parcel, and administrative data in a consistent geographic environment. Give land and property teams reliable access to spatial records needed for property management, land administration, planning, and development workflows.
Qarta logoGraph logo
Exposure aggregation map in Graph by Quarticle showing CRESTA zones; color-coded areas clearly delineate boundaries to support standardized risk modeling and portfolio planning.

11. Mobility & Transport Planning

Combine road networks, public transport, traffic, population, and infrastructure data to understand mobility patterns and transport needs. Identify congestion, underserved areas, and infrastructure priorities to support better transport planning, network development, and investment decisions.

Qarta logoGraph logo
Geopolitical risk map in Graph by Quarticle presenting hostile acts against ships and mariners across a continental region, enabling insurance teams to monitor and assess political instability indicators impacting global portfolios.

12. Cross-Department Decision Support

Combine data from different departments and systems to give decision-makers a shared geographic view of the administration’s territory. Understand how population, infrastructure, land, environment, assets, and public services interact to support strategic planning, resource allocation, and investment decisions.

Qarta logoGraph logo
A map interface showing diverse layers, including geopolitical risk maximums in the last 12 months, hostile acts against ships, submarine cables, and vessel traffic, illustrating portfolio data intelligence for underwriting and claims optimization in Graph by Quarticle.