

From Live Advisories to Geospatial Intelligence: Tracking Tropical Cyclones and Tsunami Events in Graph

Natural hazards are dynamic. Storms evolve, forecasts change, and new events are recorded continuously. For organisations working with climate risk, the challenge is not only accessing hazard data, but also keeping it current and making it useful in a spatial context.
Graph by Quarticle addresses this challenge by bringing two types of NOAA hazard data into an interactive geospatial interface: a live tropical cyclone forecast layer and a continuously updated global tsunami events layer. Automated workflows help keep both layers up to date, showing how public hazard information can be transformed into accessible, actionable geospatial intelligence.
Tracking tropical cyclones
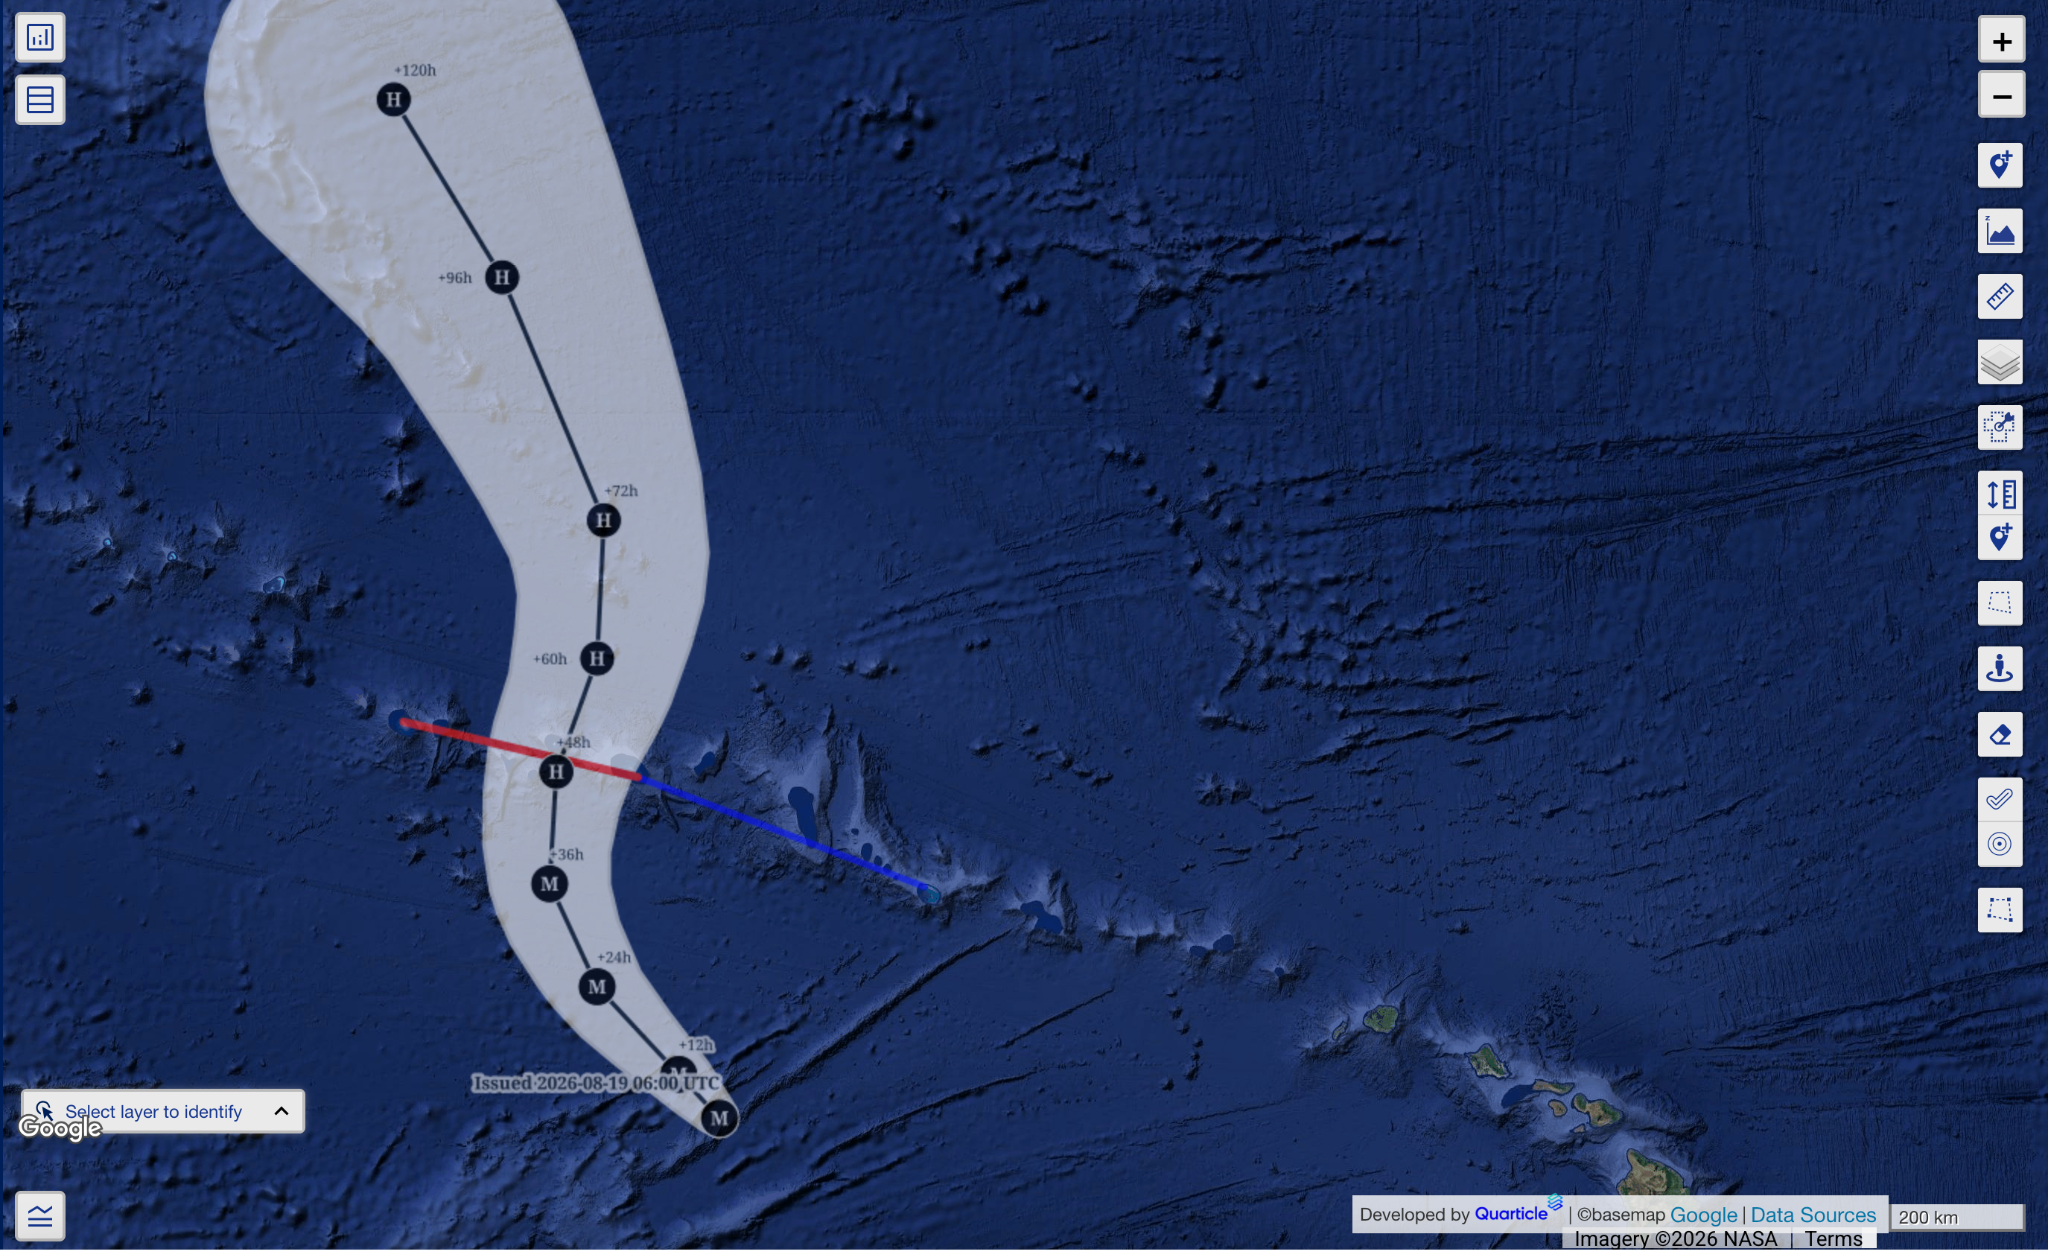
Based on NOAA advisories, Graph combines key information about active tropical systems in a single forecast map:
- Current and forecast positions for active systems.
- Category-coded locations using D for depression, S for storm, H for hurricane, and M for major hurricane.
- Advisory timestamps and forecast horizons, including +12h, +24h, +36h, +48h, +60h, +72h, +96h, and +120h.
- Historical and forecast storm tracks.
- The cone of uncertainty around the projected path.
- Coastal watches and warnings, where available.
Users can select forecast features to view additional information, including the storm identifier, basin, storm name, storm type, advisory date, and advisory timestamp.
The forecast data is updated through an Airflow DAG that periodically scans NOAA’s CurrentStorms.json endpoint. When new advisories are issued, the workflow updates the corresponding information in Graph.
This creates a direct connection between NOAA’s changing data and the Graph map interface, keeping the forecast layer updated and helping users explore the latest information in a geographic context. It serves as a practical example of event-driven geospatial data management, where the map functions as a continuously refreshed view rather than a static product.
Mapping global tsunami events
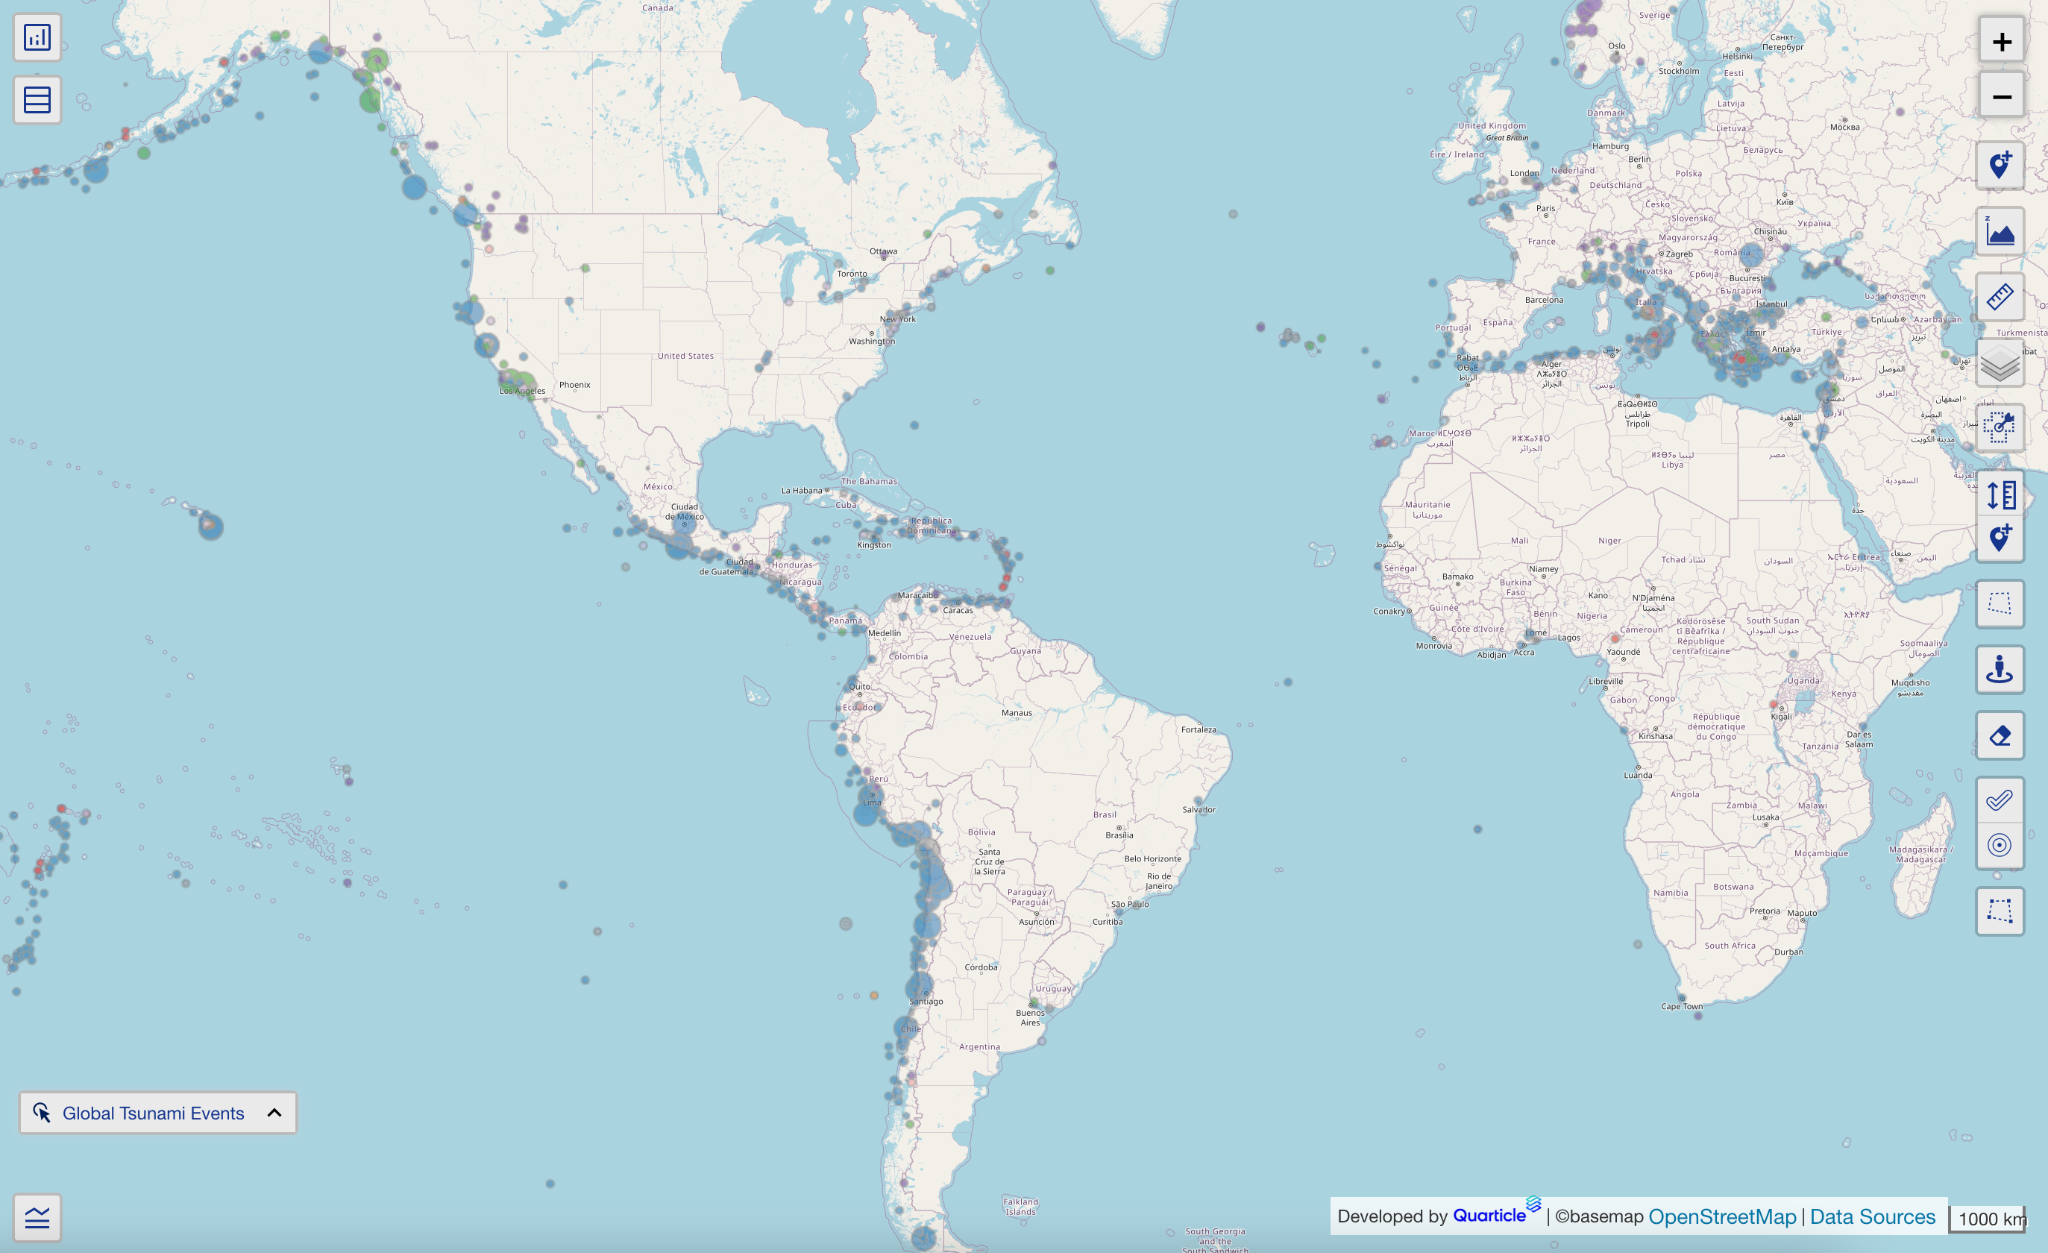
Graph also includes a Global Tsunami Events layer based on NOAA data. It maps tsunami events worldwide, with event causes represented by different colours, including categories such as earthquakes and landslides. Point size represents event intensity according to the Soloviev–Imamura tsunami intensity scale.
This visualisation helps users explore the geographic distribution of events, distinguish them by cause, and compare their relative intensity across coastlines and ocean basins.
The Global Tsunami Events layer is supported by an automated Airflow DAG that continuously synchronises it with the NOAA database. This reduces the need for manual updates and helps keep the information current, while ensuring that new source data can be incorporated consistently.
From data pipelines to decisions
The two layers support different types of analysis. The tropical cyclone layer focuses on current conditions and forecast information, while the tsunami layer provides a global view of recorded events, their causes, and their intensity.
Together, they show how automated data pipelines support geospatial intelligence:
- NOAA provides the source data
- Airflow manages the recurring update process
- Graph presents the results as interactive map layers
For teams working with hazard information, the value is not simply having access to the data, but being able to view updated information spatially alongside other datasets relevant to a particular location or area of interest.
This can provide useful geographic context for monitoring potential exposure, examining coastal areas, or assessing relationships between hazard events and assets, routes, facilities, or other location-based data.
Explore Graph by Quarticle to see these hazard layers in action.
Data sources: NOAA tropical cyclone advisories and NOAA tsunami data.
